







Looking for retail jobs after 55 in Canada? Start by comparing the kinds of retailers around you, then check the actual duties and conditions. New Statistics Canada research shows how older workers were represented across retail subsectors in 2024. It offers context for a search, not a prediction of who will hire you.
Our map covers every subsector in the published age table. It separates ages 55–64 from ages 65 and over, calculates their combined share and compares each group with all retail. Four downloadable CSVs let you check the calculations, record local vacancies and question an offer before deciding.
Prepared 28 October 2026. Statistics Canada released the study on 21 October 2026, covering 2017–2024. The figures below describe historical national workforce composition. They are not a count of October 2026 vacancies, employer age preferences or individual hiring odds.
Retail jobs after 55 Canada: where older workers are represented
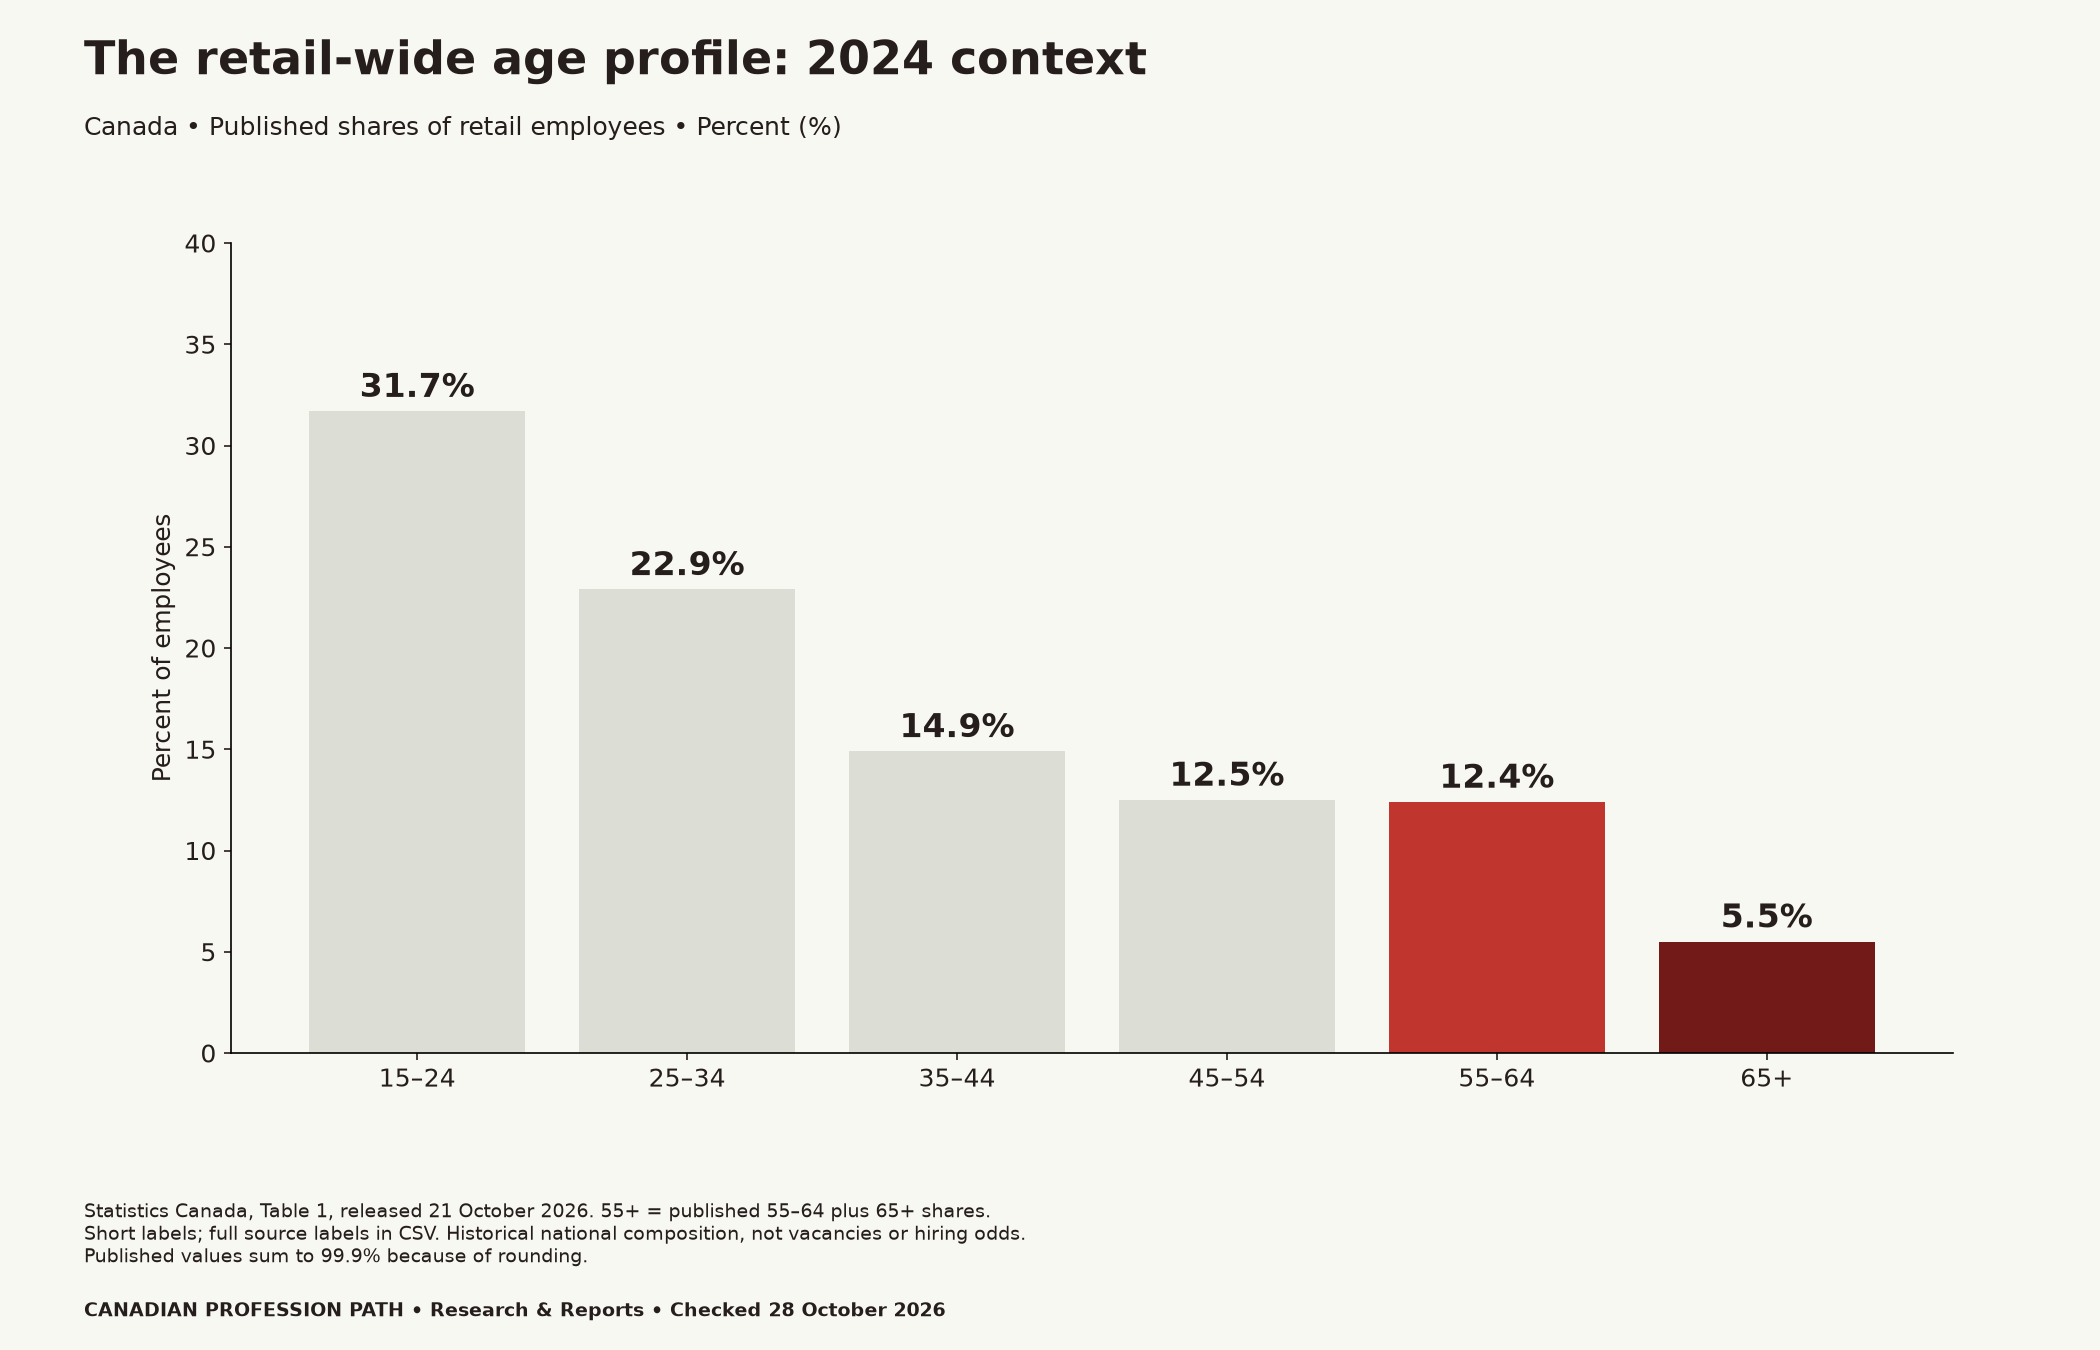
In Statistics Canada’s Table 1, employees aged 55–64 made up 12.4% of retail, while those aged 65 and over accounted for 5.5%. Adding the two published values gives a 17.9% share aged 55 and over. We apply that same formula to all nine subsectors.
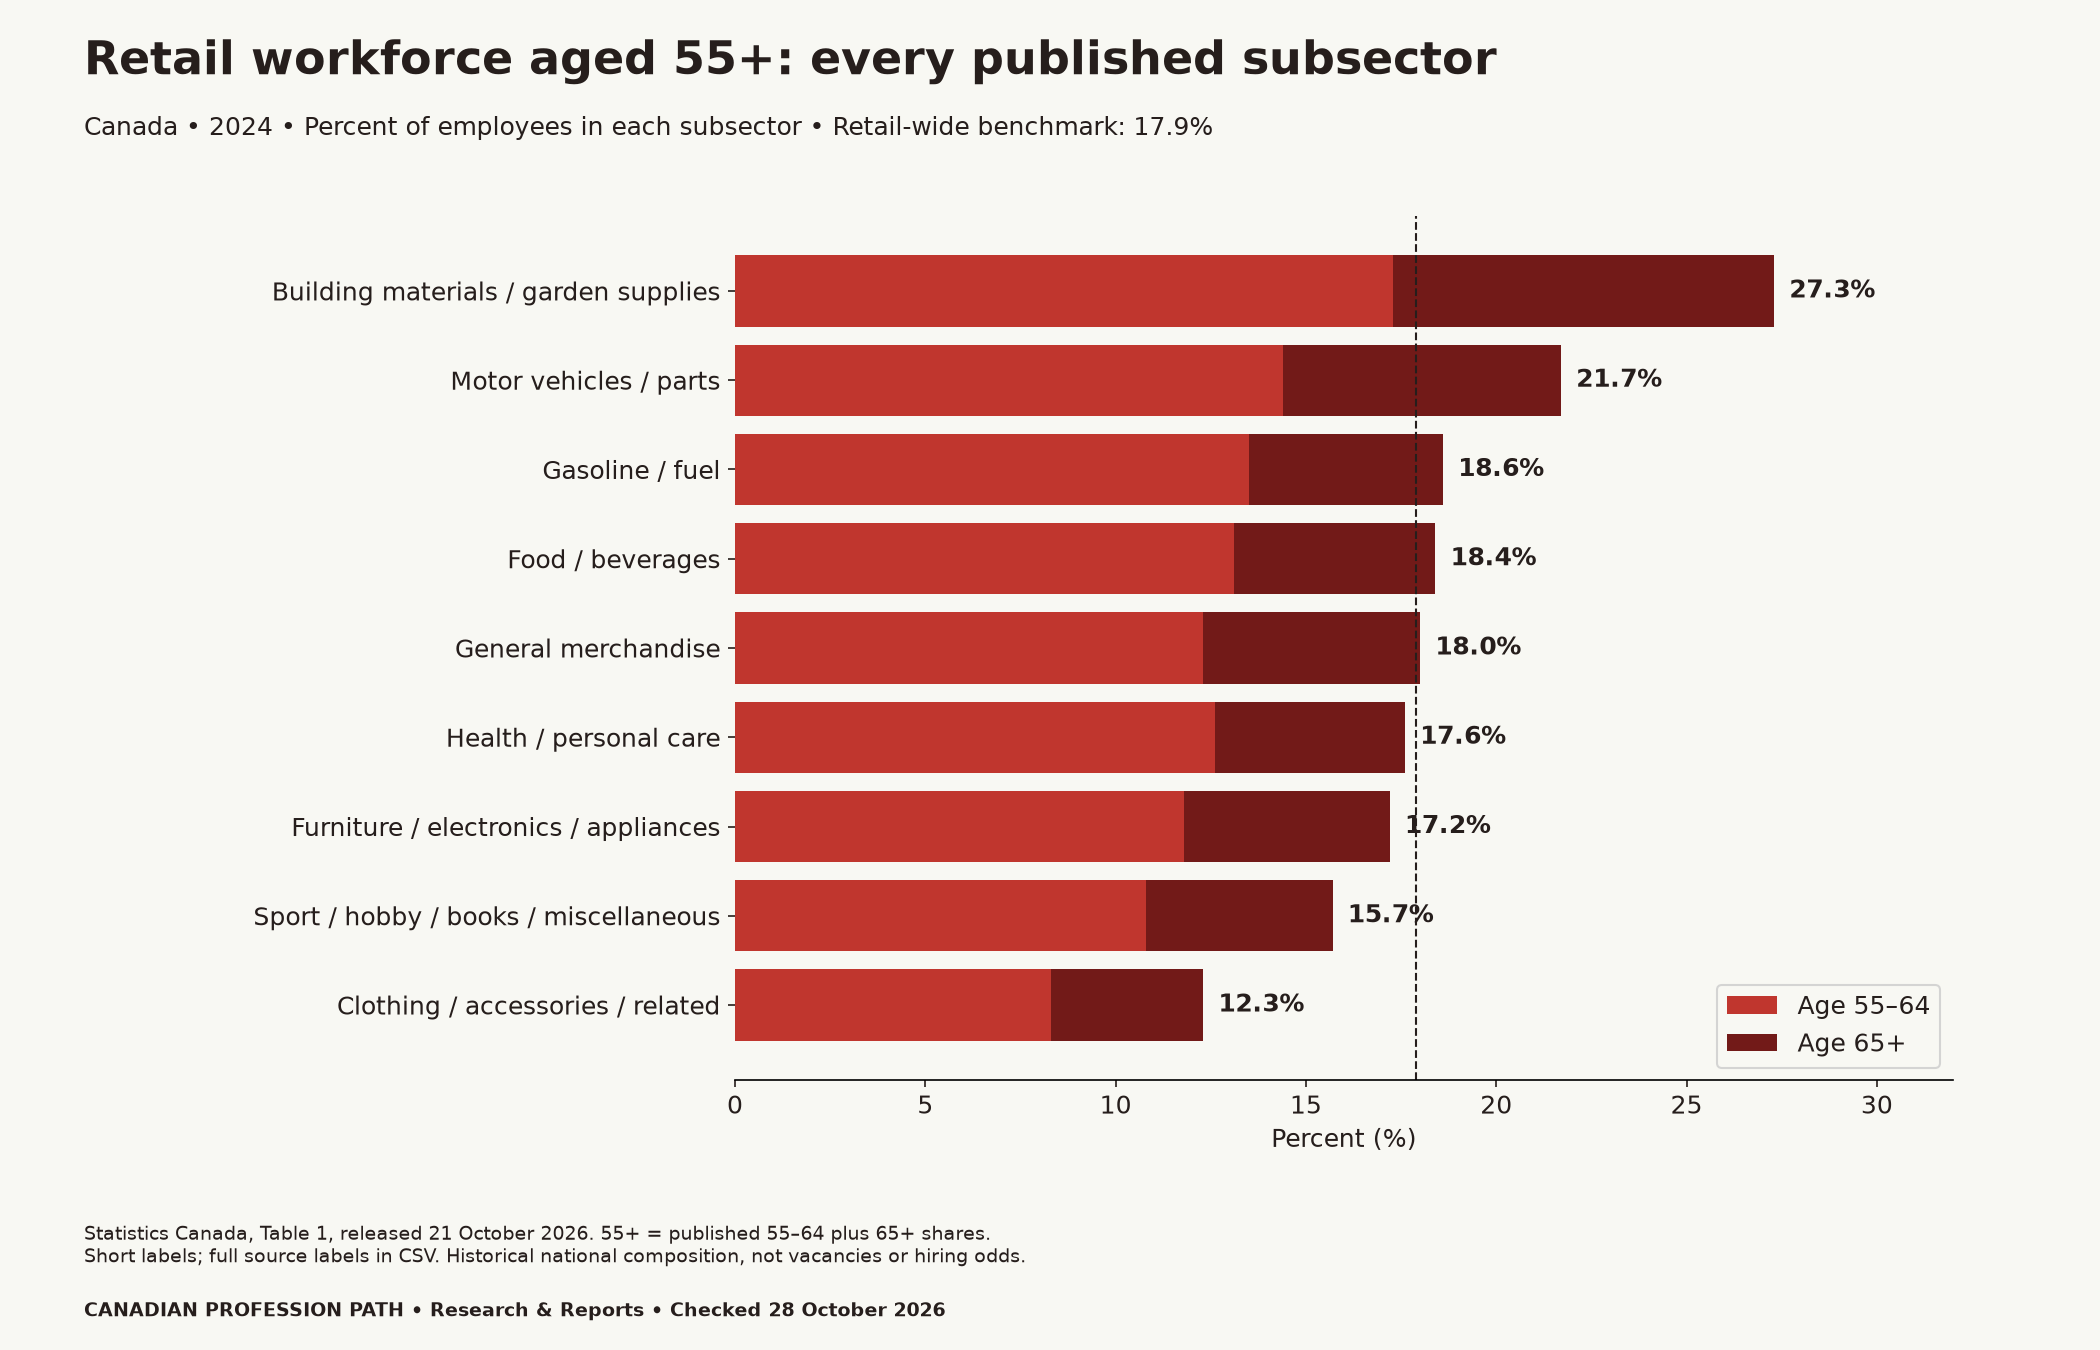
Building material and garden equipment and supplies dealers have the largest calculated share, at 27.3%. Motor vehicle and parts dealers follow at 21.7%. Clothing and related retailers have the smallest share in this table, at 12.3%. These rankings describe who worked in each group; they do not rank employers by accessibility or willingness to recruit.
A small specialty store and a large chain can have different tasks within the same subsector. Similarly, a garden centre may offer customer advice, inventory work or physically demanding stock handling. Therefore, use the map to broaden the employers you investigate, then read each vacancy on its own terms.
Compare percentage points, not promises of easier hiring
The building and garden share exceeds the retail-wide share by 9.4 percentage points: 27.3 minus 17.9. Motor vehicles and parts are 3.8 points above the benchmark. By contrast, clothing and related retailers are 5.6 points below it. These are descriptive differences, without a statistical significance test.
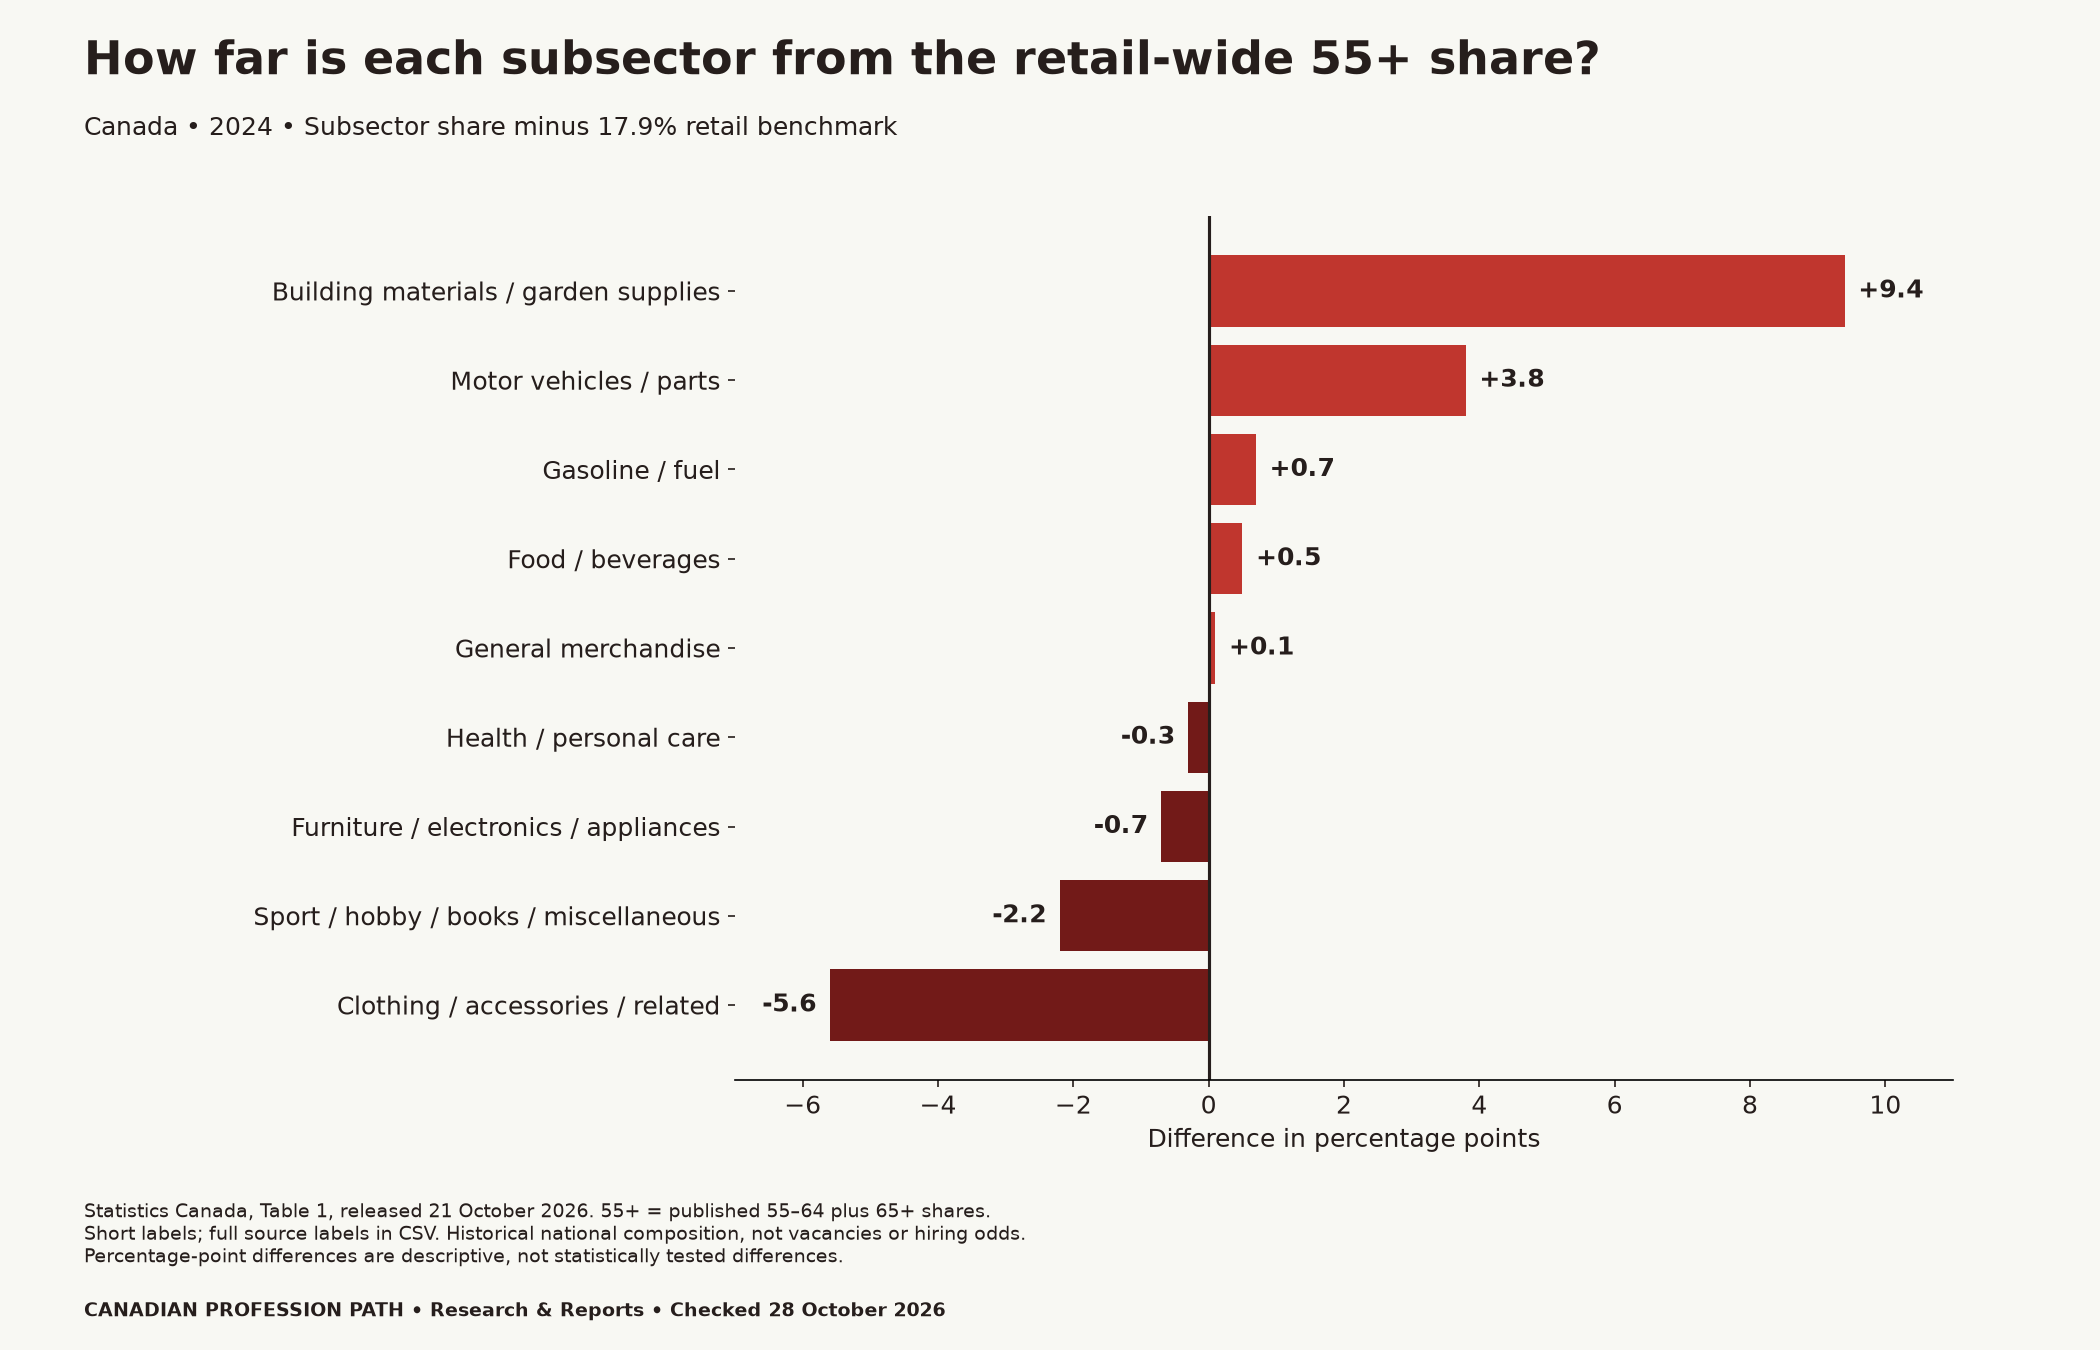
The retail-wide benchmark is an aggregate reported by the source. We do not calculate it by averaging the nine subsector percentages. An unweighted average would treat a small subsector as if it employed as many people as a large one. We also keep the aggregate out of the subsector ranking.
Read the whole age profile and the historical trend
Retail includes workers across adulthood. In 2024, the published shares were 31.7% aged 15–24, 22.9% aged 25–34 and 14.9% aged 35–44. Another 12.5% were aged 45–54. The two older bands together account for 17.9%. Published rounded values sum to 99.9%, rather than exactly 100%.
The study also reports a rise in the retail-wide share aged 65 and over, from 3.7% in 2017 to 5.5% in 2024. That is an increase of 1.8 percentage points. In building and garden supplies, the corresponding share rose from 6.2% to 10.0%, an increase of 3.8 points.
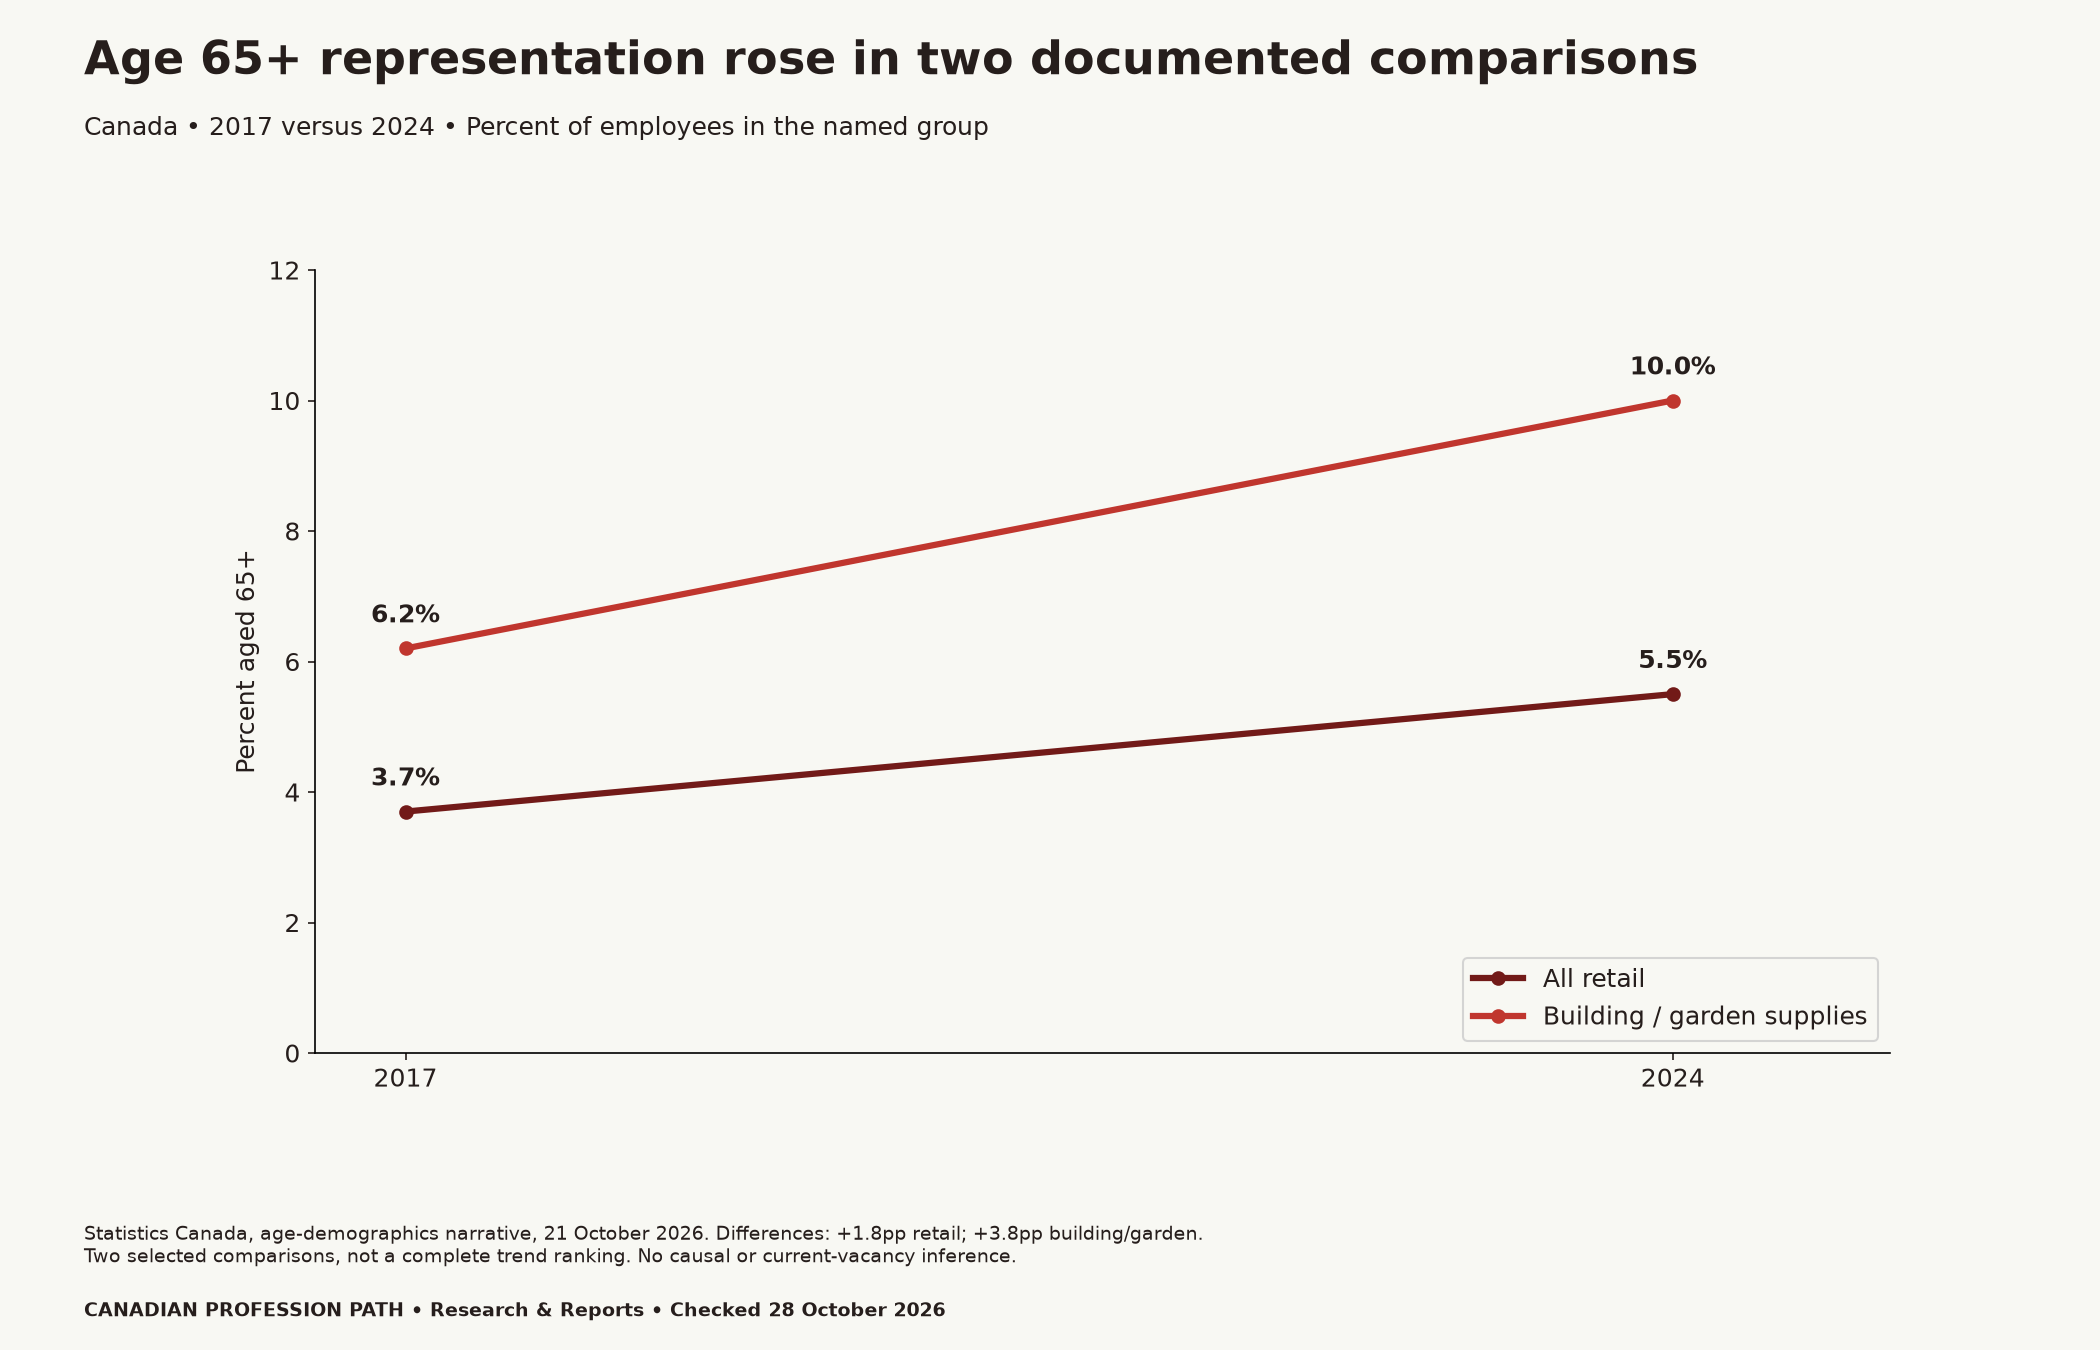
Workforce shares can change for several reasons, including changes in other age groups. A larger share does not by itself establish an increase in job openings. Nor does it reveal whether people work by choice, because of financial pressure, or for another reason. The table cannot answer those personal questions.
Move from the workforce map to a current vacancy
Choose a manageable set of nearby employers across several relevant subsectors. For each opening, record the original employer URL, posting date, location and essential duties. Then separate what the advert states from what you still need to ask. Our vacancy log is blank; we have not conducted a local vacancy census.

Translate previous experience into concrete examples. Customer service, stock accuracy, product explanation and resolving problems may transfer from other jobs. However, check which tasks the specific role requires. For a supervisory opening, our retail manager interview guide offers broader preparation prompts; the age map does not establish your qualifications.
Newcomers can describe relevant experience from outside Canada using clear examples and references they are authorised to share. Ask which local product, safety or system training the employer provides. Do not assume that a national workforce share establishes work authorisation, recognition of credentials or an employer’s recruitment policy.
Questions to resolve before accepting an offer
First, clarify lifting, standing, equipment and the frequency of demanding tasks. Ask about the actual role rather than making assumptions about a person’s age or capacity. Next, establish guaranteed hours, variable hours and how far ahead the employer sets shifts. A job title alone does not describe a predictable schedule.
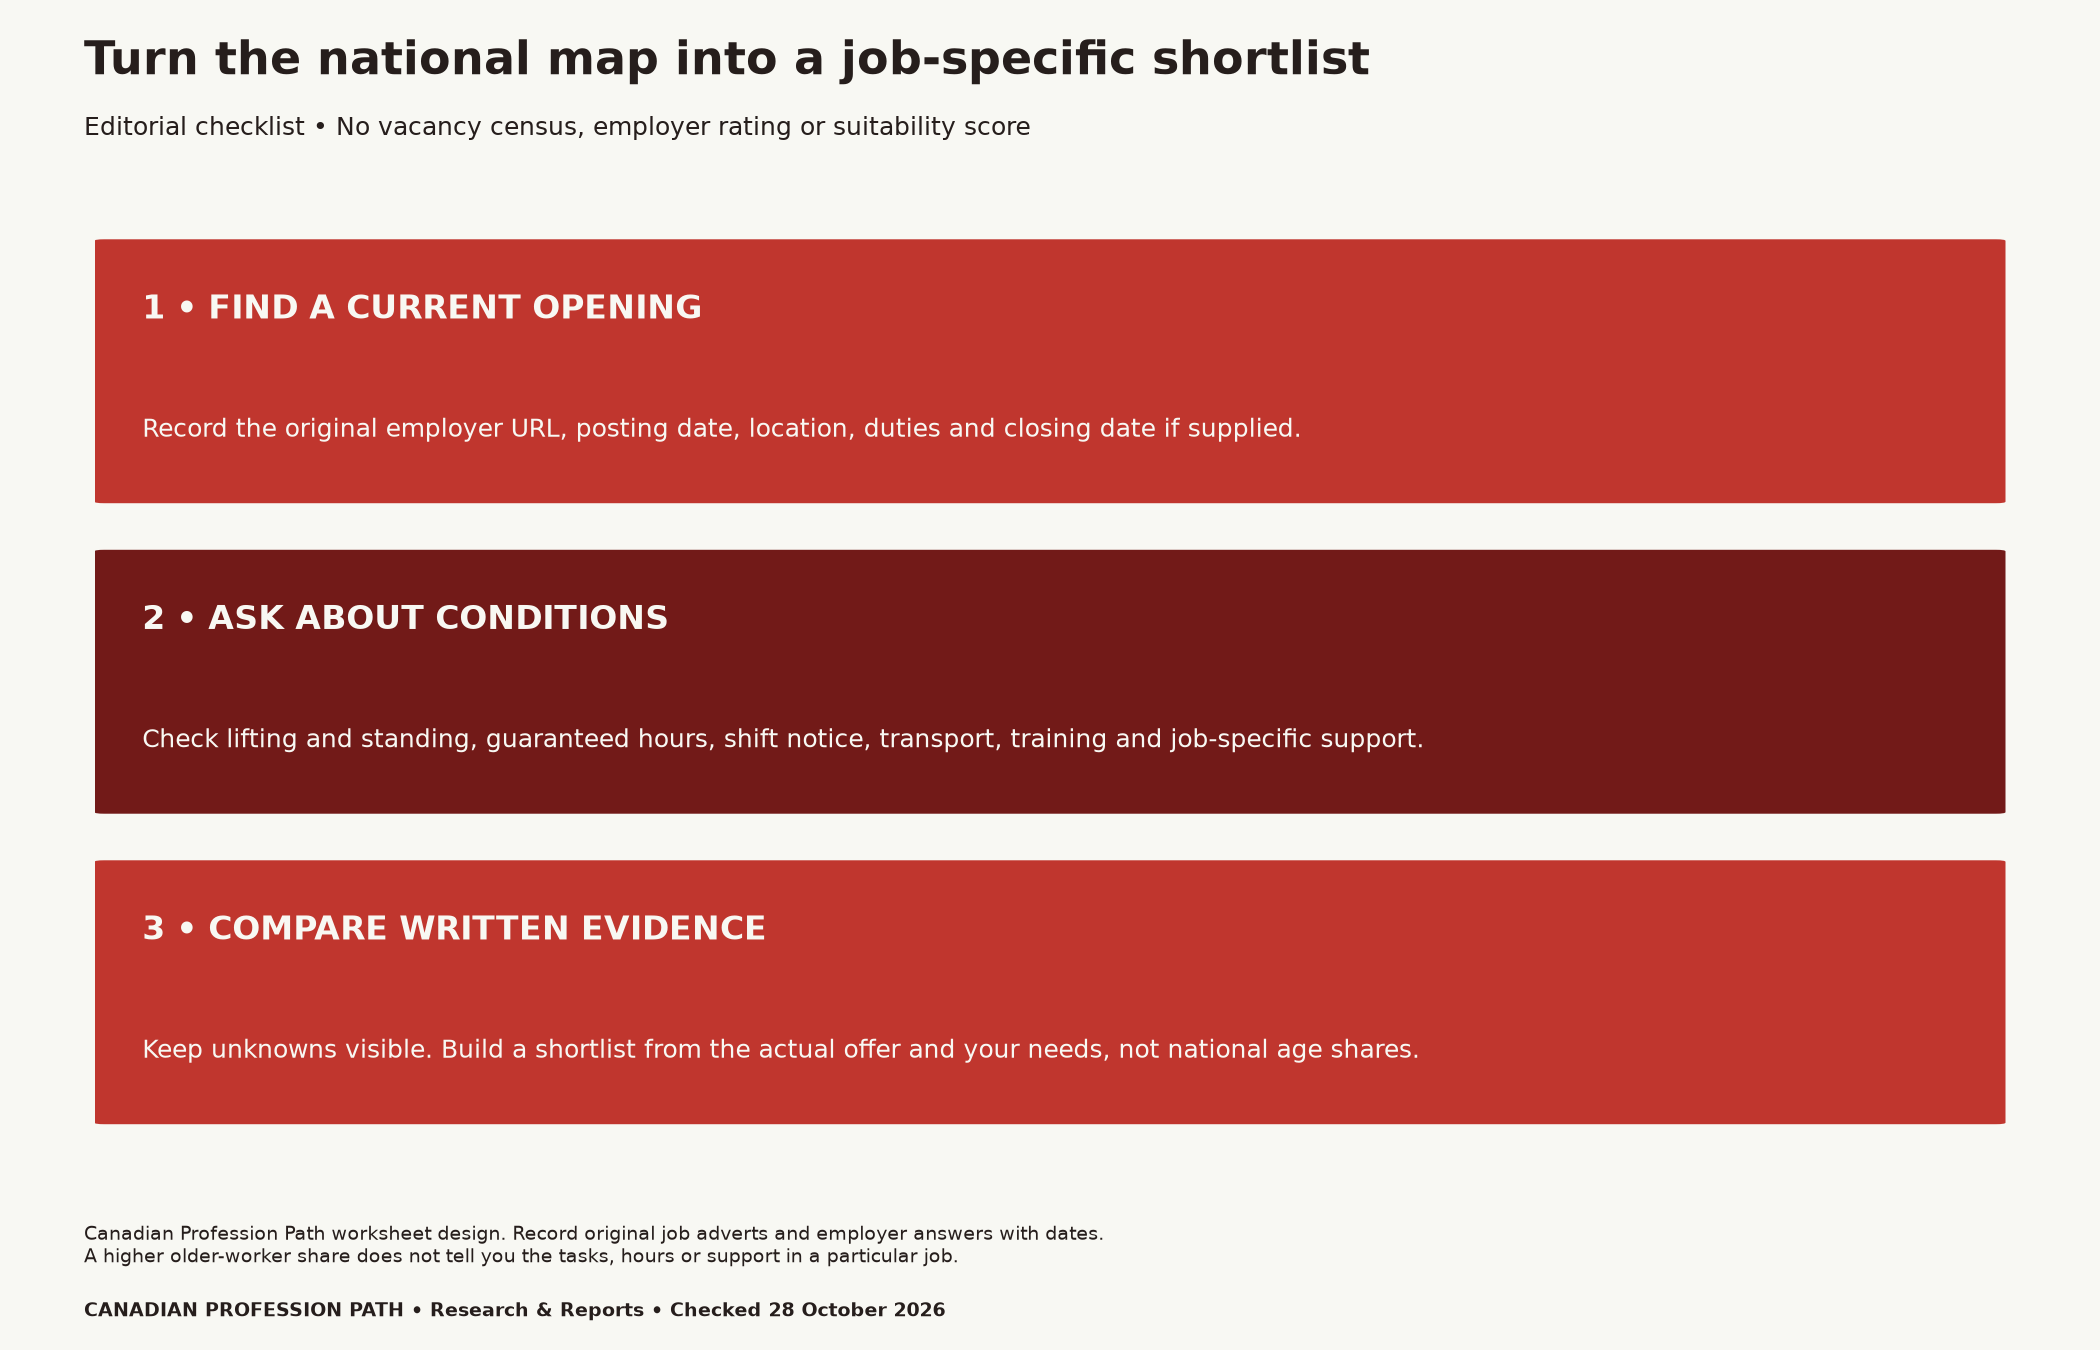
Also check whether transport works for early starts and late finishes. Ask who provides training and how competence is assessed. If you need job-specific support, discuss the relevant requirements privately with the employer. Keep sensitive health or identity documents out of a public job-search worksheet.
The source study discusses full-time and part-time work using an earnings-based proxy derived from industry wages. That is not a direct observation of weekly schedules. We therefore do not use its classification to promise particular hours. Ask the employer for the written arrangements that apply to the actual vacancy.
Method, downloads and limits
We transcribed all ten rows of Table 1: the retail aggregate and nine subsectors. We retained the six published age bands and calculated 55+ as 55–64 plus 65+. Values remain at one decimal place. The study uses Business Register and administrative data; its introduction describes T4 employees and self-employed people, excluding other employment types such as contract workers.
Our rank is descriptive, national and historical. It does not identify local vacancies, physical suitability, pay, discrimination or recruitment success. The selected trend file contains only the two age-65+ comparisons discussed above. Our offer and vacancy tools are editorial blank templates, not an assessment or recommendation to accept a job.
Download the complete age-share table (CSV): ten source-labelled rows, six age bands, derived 55+ shares and percentage-point gaps.
Get the selected historical trend data (CSV): four observations for the two clearly identified 2017–2024 comparisons.
Use the blank local vacancy log (CSV): record original adverts, dates, duties, conditions and unresolved questions. No vacancies are prefilled.
Open the offer-screening worksheet (CSV): seven question areas with empty employer-response and evidence fields.
Suggested citation: Pathfinder Editorial, Canadian Profession Path (28 October 2026), “Retail Careers After 55 in Canada: A Subsector Workforce Map.” Cite Howe and Tobin’s Statistics Canada study for the underlying values, and this article for the calculated comparisons and editorial worksheets.


