







Searching for rural jobs in Canada requires a closer look than a single unemployment rate. Accommodation and food services, finance-related industries, and information, culture and recreation recorded employment gains in the latest rural breakdown. Yet total rural employment fell. The useful question is which local roles match your skills and offer work you can sustain.
This report examines industries, rather than ranking towns or promising easy hiring. It is for Canadian residents planning their next step, including newcomers. We use Statistics Canada’s rural dashboard release of 15 October 2026, covering September 2026 compared with September 2025. Research was checked on 21 October.
Rural jobs: what changed in the latest figures?
Employment in rural and small town Canada fell by 83,600 people, or 3.1%, over the year. The unemployment rate nevertheless moved down from 4.9% to 4.7%. Both observations come from the official rural employment dashboard. The estimates are not adjusted for seasonal patterns.
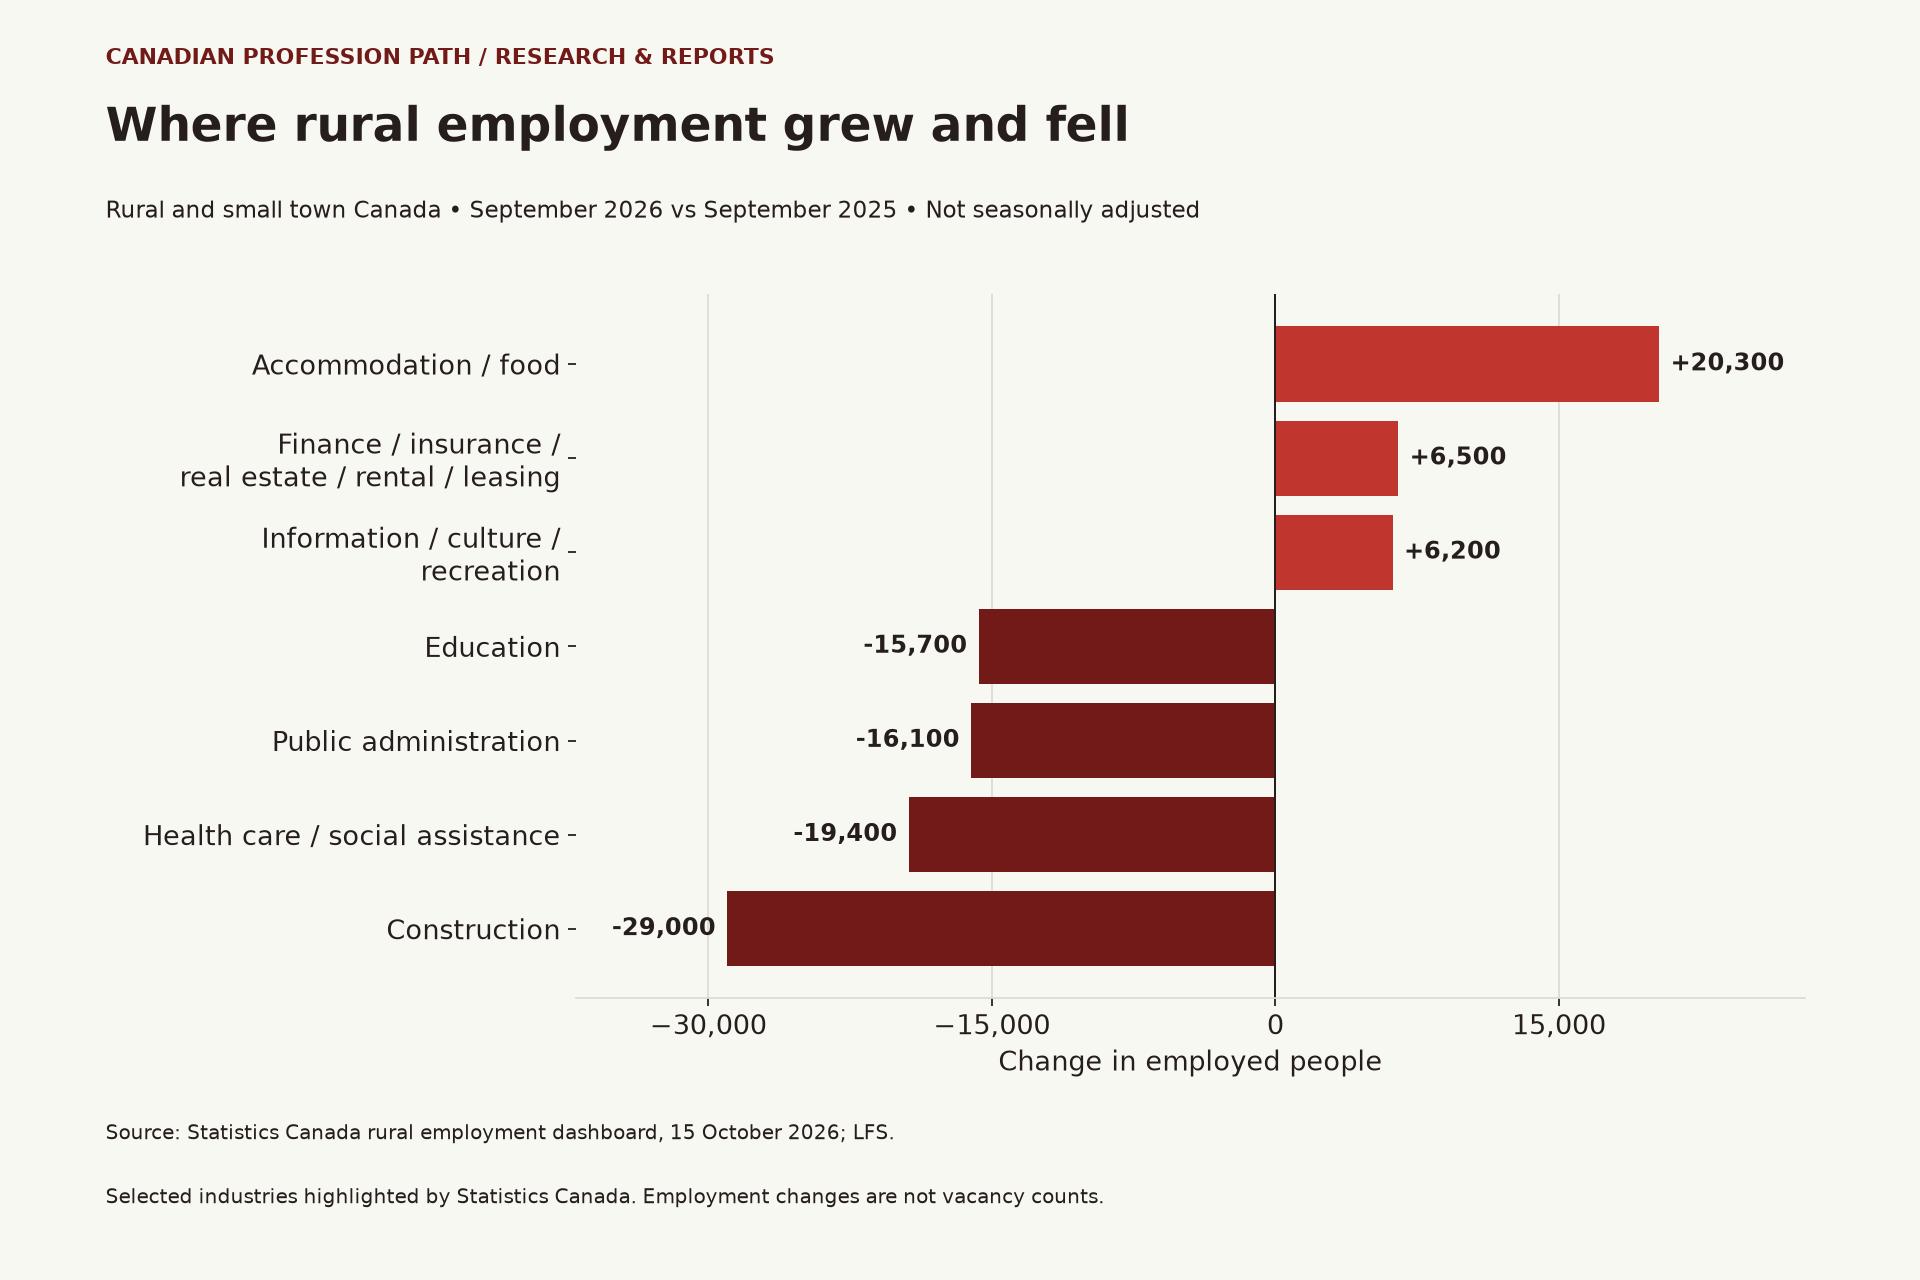
- Accommodation and food services: employment rose by 20,300, or 15.3%.
- Finance, insurance, real estate, rental and leasing: employment rose by 6,500, or 6.8%.
- Information, culture and recreation: employment rose by 6,200, or 9.2%.
The largest declines highlighted in the release were construction, down 29,000 (9.8%); health care and social assistance, down 19,400 (5.2%); public administration, down 16,100 (11.8%); and educational services, down 15,700 (8.6%). These figures describe changes in employed people, not advertised vacancies or a count of layoffs.
Compare the number of people with the growth rate
A percentage change describes growth relative to an industry’s earlier size. A count describes the scale of the change. You need both when deciding which sectors deserve further investigation. Neither tells you how many suitable openings currently exist in your community.
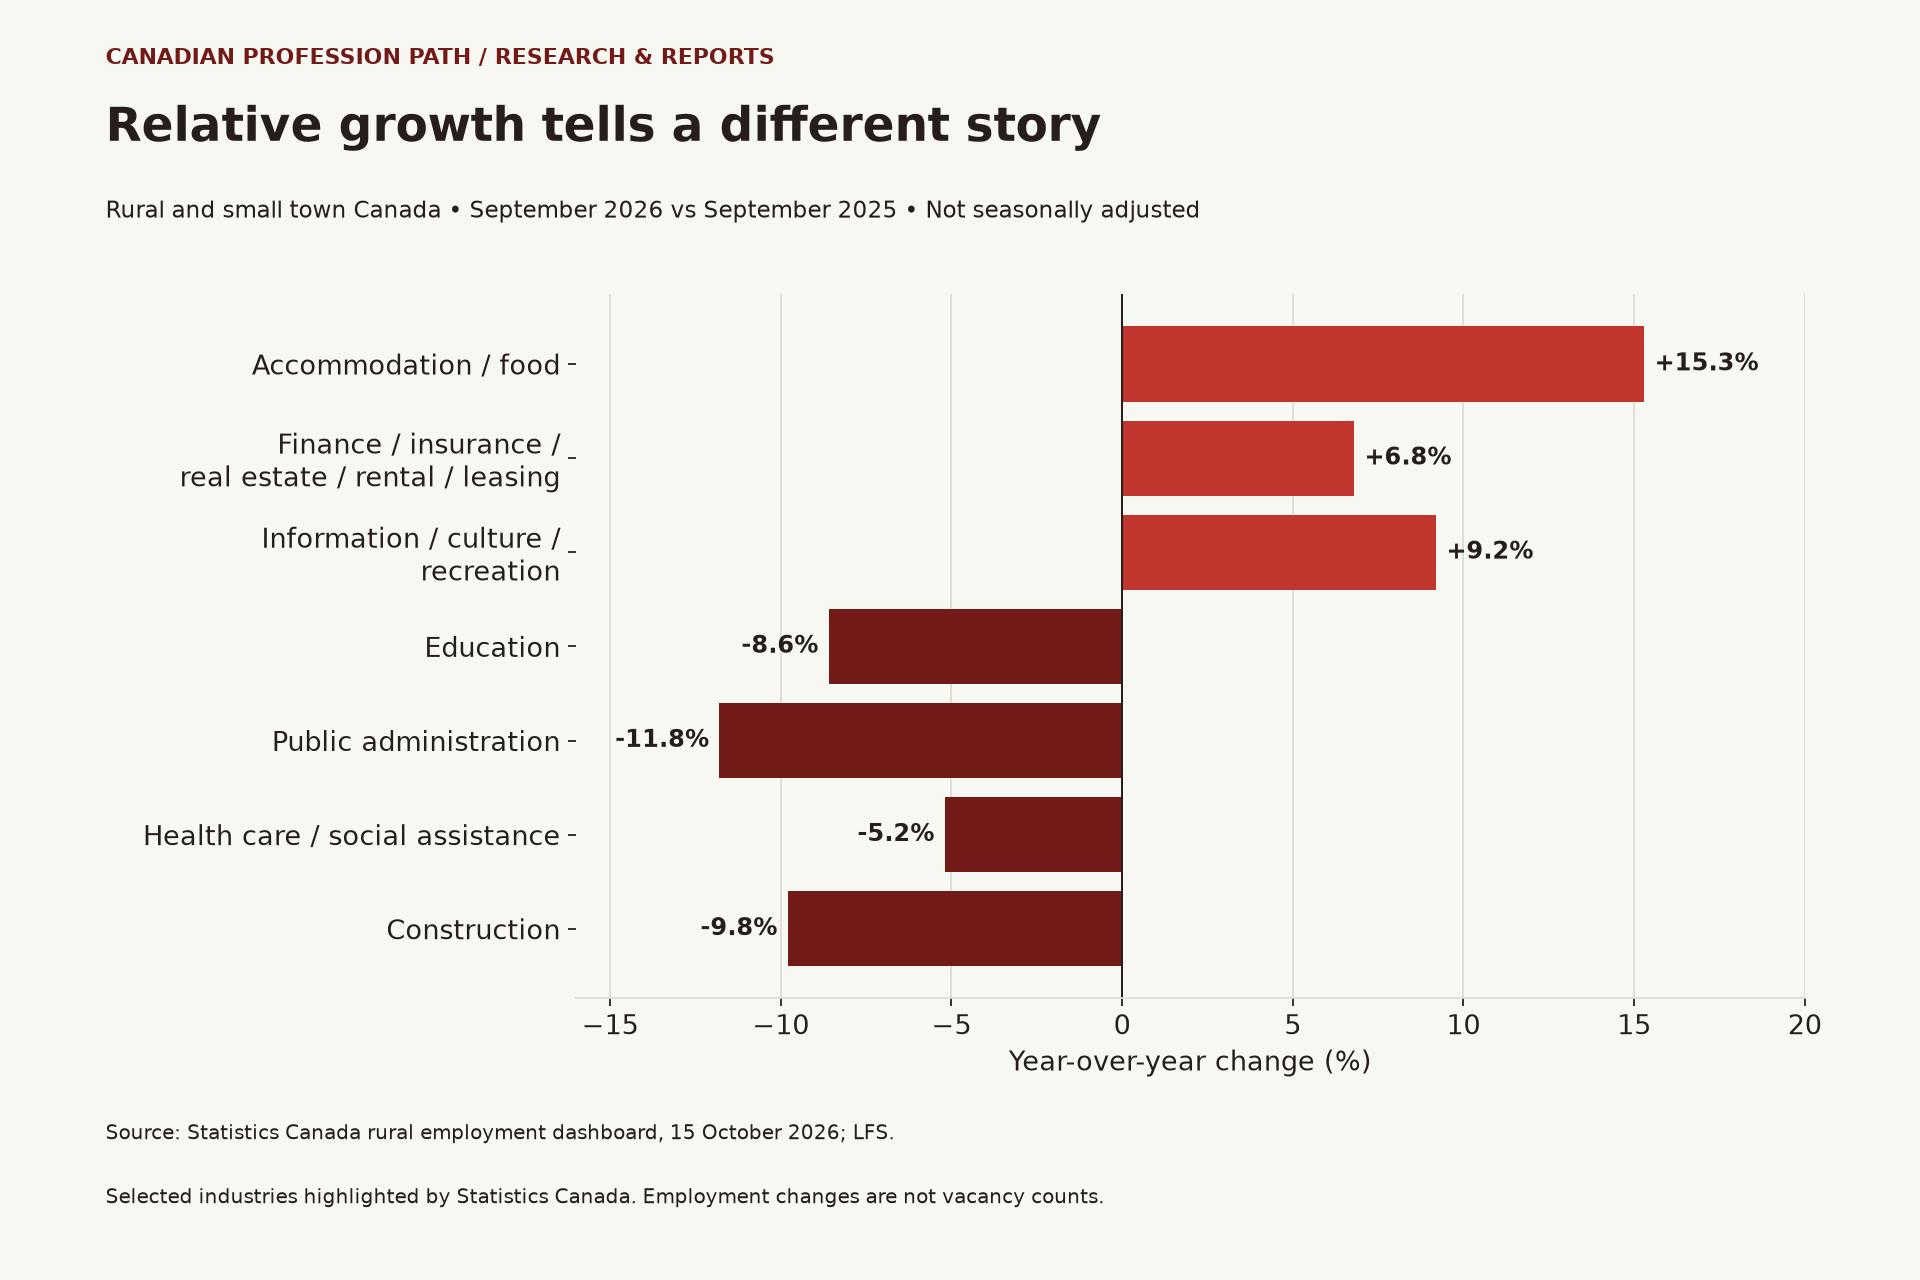
For example, the finance-related group added slightly more employed people than information, culture and recreation. However, its percentage increase was smaller. That difference reflects the size of the starting groups. Choosing a career solely from the highest percentage would miss the duties, entry requirements and local availability that matter to you.
Why growing industries can coexist with fewer rural jobs
The three highlighted growing groups added 33,000 employed people combined: 20,300 + 6,500 + 6,200. Total rural employment fell by 83,600. Therefore, all other industries combined changed by −116,600, calculated as −83,600 − 33,000.
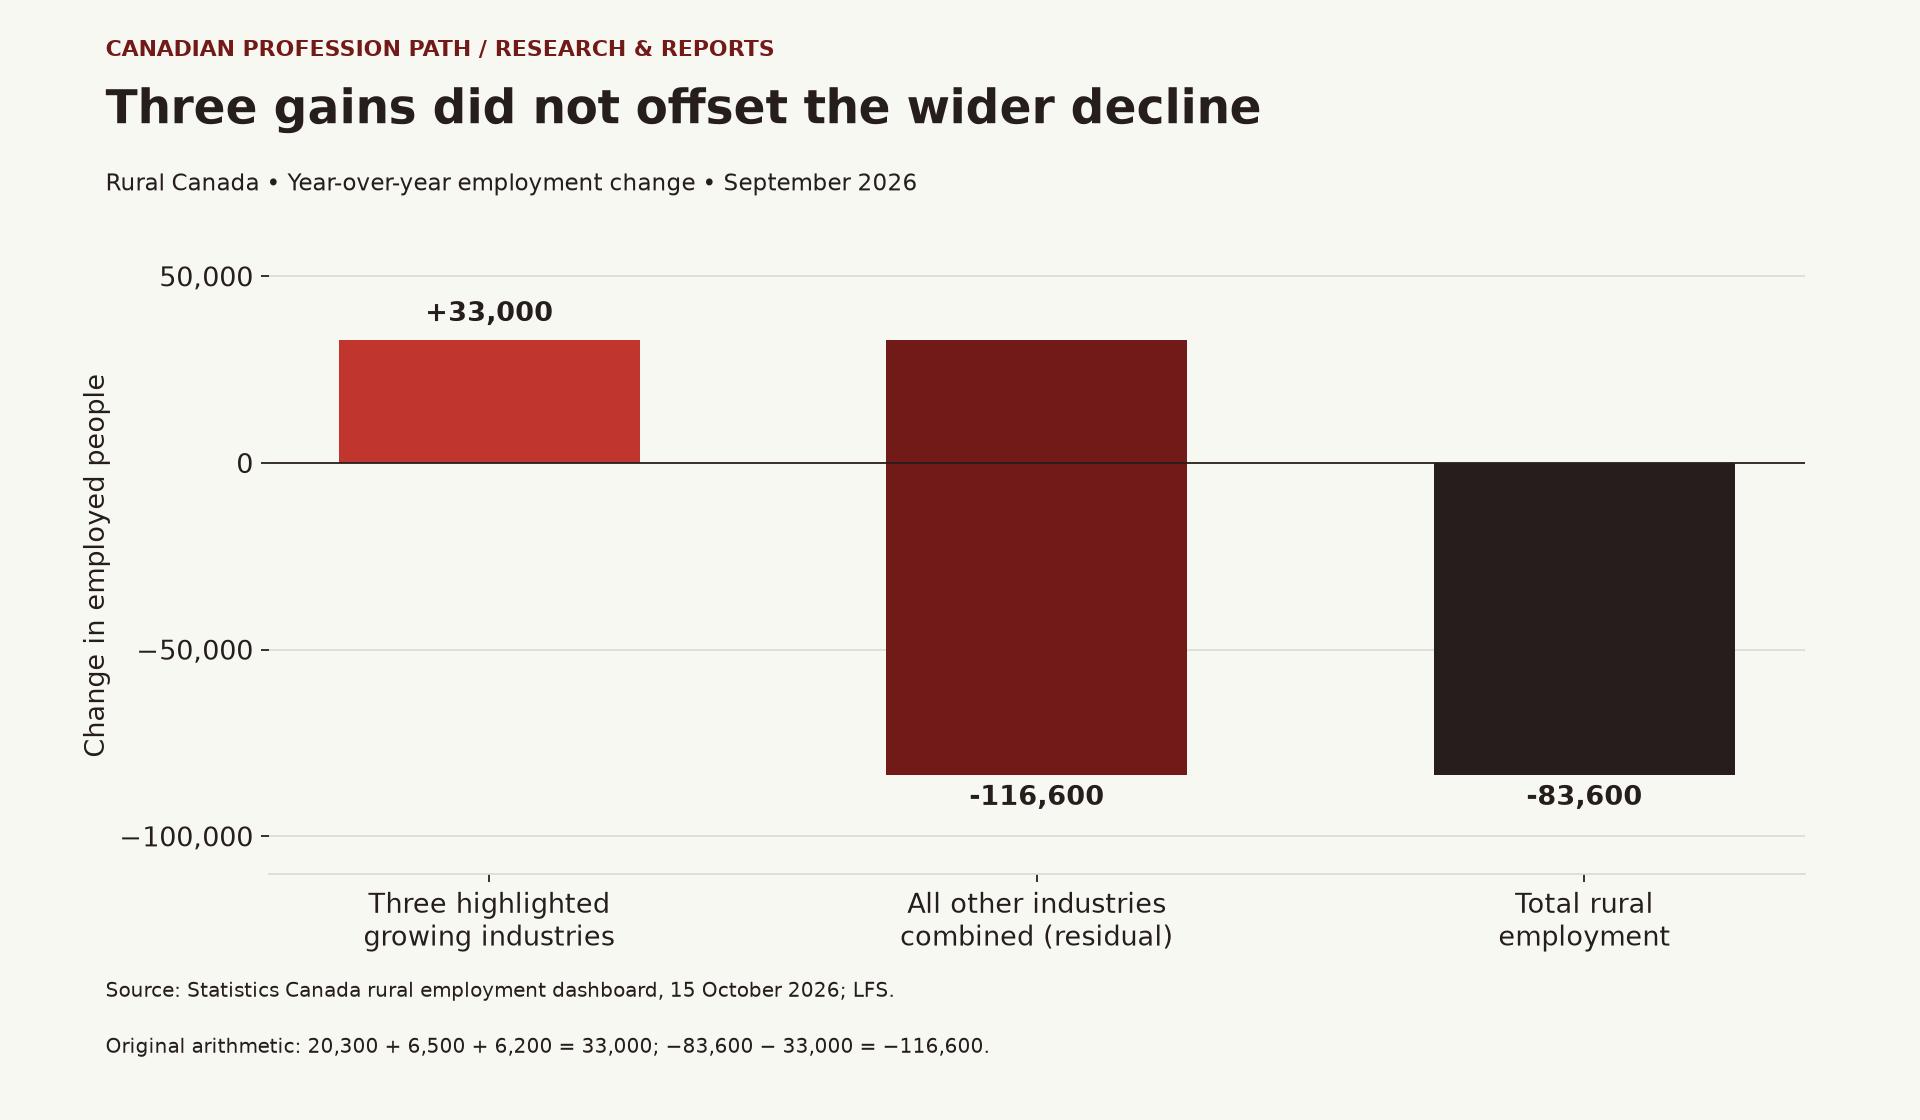
This calculation explains how encouraging sector headlines fit a weaker total. It does not show why people entered or left employment. Nor does it imply every industry in the residual declined. Some may have grown while others contracted more sharply.
Why a lower unemployment rate does not prove more hiring
The unemployment rate measures unemployed people as a share of the labour force. The labour force includes employed and unemployed people; it does not include every resident. The Guide to the Labour Force Survey explains those definitions and the survey’s coverage.
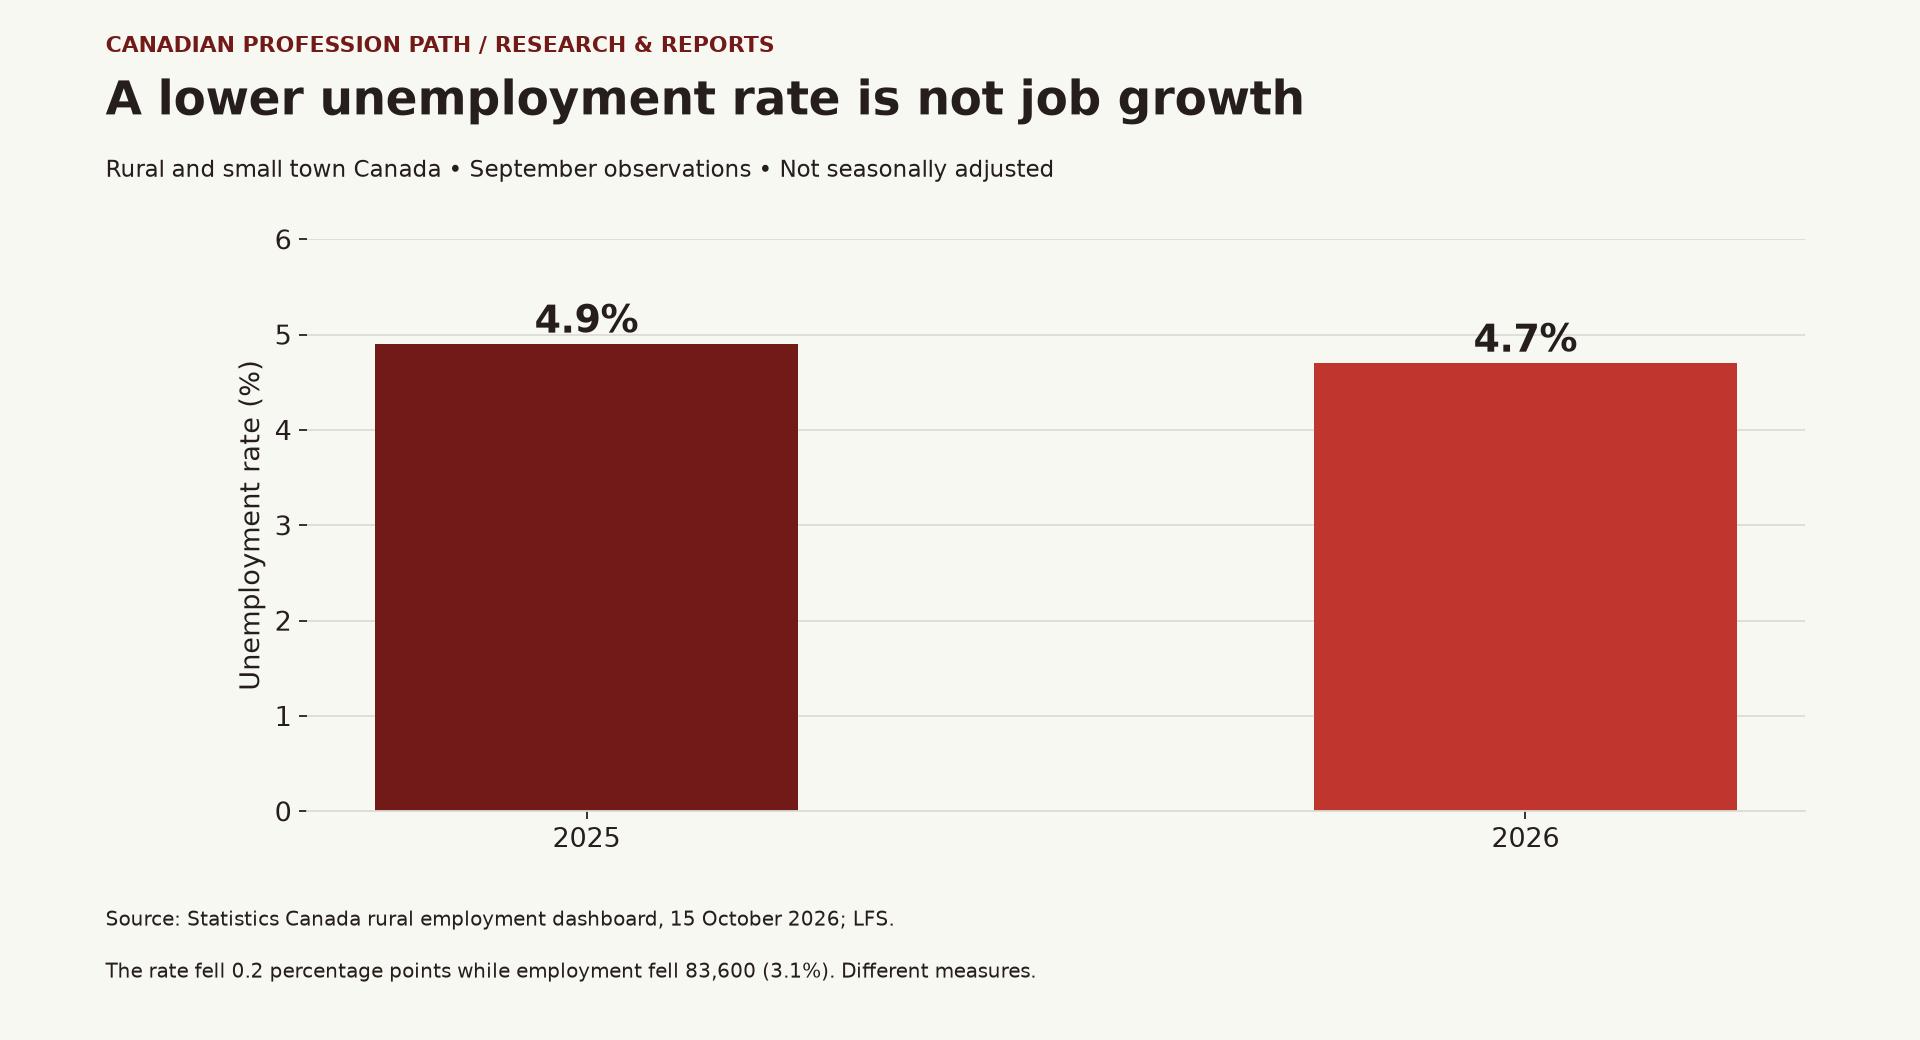
A simple hypothetical example shows the arithmetic. Suppose a community has 1,000 people in its labour force, including 50 unemployed: its rate is 5%. Later, it has 900 in the labour force and 36 unemployed: its rate is 4%. Employment has fallen from 950 to 864 even though the rate is lower.
That example is not an estimate for rural Canada and does not explain the actual September change. It only demonstrates why the two measures can move together. To explain a real community’s experience, examine employment, unemployment, participation and population over time, with comparable definitions.
Turn industry signals into a search for actual roles
An industry describes the employer’s business. An occupation describes the work a person does. A hotel can employ maintenance workers and bookkeepers as well as hospitality staff. A financial-services employer can need administrative and technology skills alongside specialist roles. Industry growth does not identify which of those positions are open.
Start with the Job Bank occupation search to compare duties, requirements, wages and available jobs. Then use its regional occupation outlooks for a more specific view. Check the reference dates and geographic coverage; an outlook is different from a current vacancy.
For residents considering health work, our LPN versus RN research compares nursing pay and vacancy evidence. Its national occupation measures answer a different question from this rural health-industry change. Read the classifications before using one result to interpret the other.
Use a local opportunity check before paying for training
- Name the role: identify the occupation and tasks, rather than searching only for a broad industry.
- Build an employer list: record local organizations that actually employ people in that role.
- Check dated vacancies: note posting dates, closing dates and whether repeated adverts describe the same opening.
- Compare work terms: record hours, seasonality, contract length, pay range and required travel.
- Verify entry requirements: separate legal or regulatory requirements from an employer’s preferred experience.
- Ask about progression: identify supervision, skills development and the next role you could realistically pursue.
For a mid-career change, compare the first year of the new route with your existing responsibilities. A job with an attractive hourly rate may still offer too few hours or an unsuitable schedule. Ask the employer about ordinary hours and the periods when work slows down. Do not substitute an industry average for an offer.

Newcomer guidance: verify the route into the occupation
If you are new to Canada, choose the province or territory and the specific occupation before paying for a course. Ask the relevant regulator or apprenticeship authority whether the work is regulated and how it assesses overseas training or experience. An employer’s advert can help identify requirements, but it does not replace an official assessment.
Also check workplace language, access to transport, shift times and available settlement or employment support. Keep a list of questions that need local answers. A national rural statistic cannot establish recognition of your credentials, suitability for a specific job or eligibility for a support program.
If your plan involves a trade, our funded apprenticeships report explains the difference between organizational training investment and support a learner can receive. Its provider checklist can help you check recognition, employer placement and costs before committing.
Download the rural jobs evidence card
Our two-page local opportunity evidence card (PDF) turns these questions into a repeatable search. Use one card per role and area. Keep dated employer evidence alongside the broader industry signal. Download the rural employment chart data (CSV) to reproduce the figures and reconciliation.
Review the card after you have checked several independent employers. If the evidence is thin, expand the search or speak with a local employment service before buying training. The next useful step is often a better question, a verified vacancy or an assessment of existing skills.
Coverage, method and limitations
Statistics Canada defines rural and small town areas here as census subdivisions outside census metropolitan areas and census agglomerations. The dashboard covers people aged 15 and older. This is a statistical geography, so a place described casually as a small town may fall outside this measure.
We reproduced the dashboard’s highlighted industries and kept counts separate from percentages. Comparing September with September reduces some seasonal comparison problems, but the data remain unadjusted. Survey estimates have sampling variability, especially for smaller industries and areas. We have not tested whether differences between industries are statistically significant.
Our residual uses rounded published figures. We did not infer vacancy counts, individual hiring chances, wage returns or a causal explanation. The hypothetical unemployment example is labelled separately. No live directory of local vacancies or ranking of the best rural towns was compiled for this report.
Suggested citation: Canadian Profession Path (2026), “Rural Jobs in Canada: Where Employment Is Growing in 2026,” research edition 21 October 2026. Credit Statistics Canada for the underlying estimates and link to this report when adapting the original comparison or evidence card.


