







A job search timeline in Canada in 2026 needs two separate tools: evidence about the labour market and a private plan for your own runway. A national monthly job-finding rate cannot supply a personal hiring date. Use it to question an overconfident forecast, then review the applications, cash and constraints you can actually observe.
This report combines fresh Statistics Canada evidence with a blank application funnel, a private runway worksheet and a diagnostic tree. Our planning examples are hypothetical. No applicant outcomes were tested, and the tools do not promise faster hiring. Research checked on 9 November 2026.
What the latest job-finding rate measures
Statistics Canada’s 6 November Labour Force Survey release reports that 18.9% of people unemployed in September found work in October 2026. The corresponding figures were 19.8% in 2025 and a 24.6% average for the same monthly transition in 2017–2019. These estimates are not seasonally adjusted.
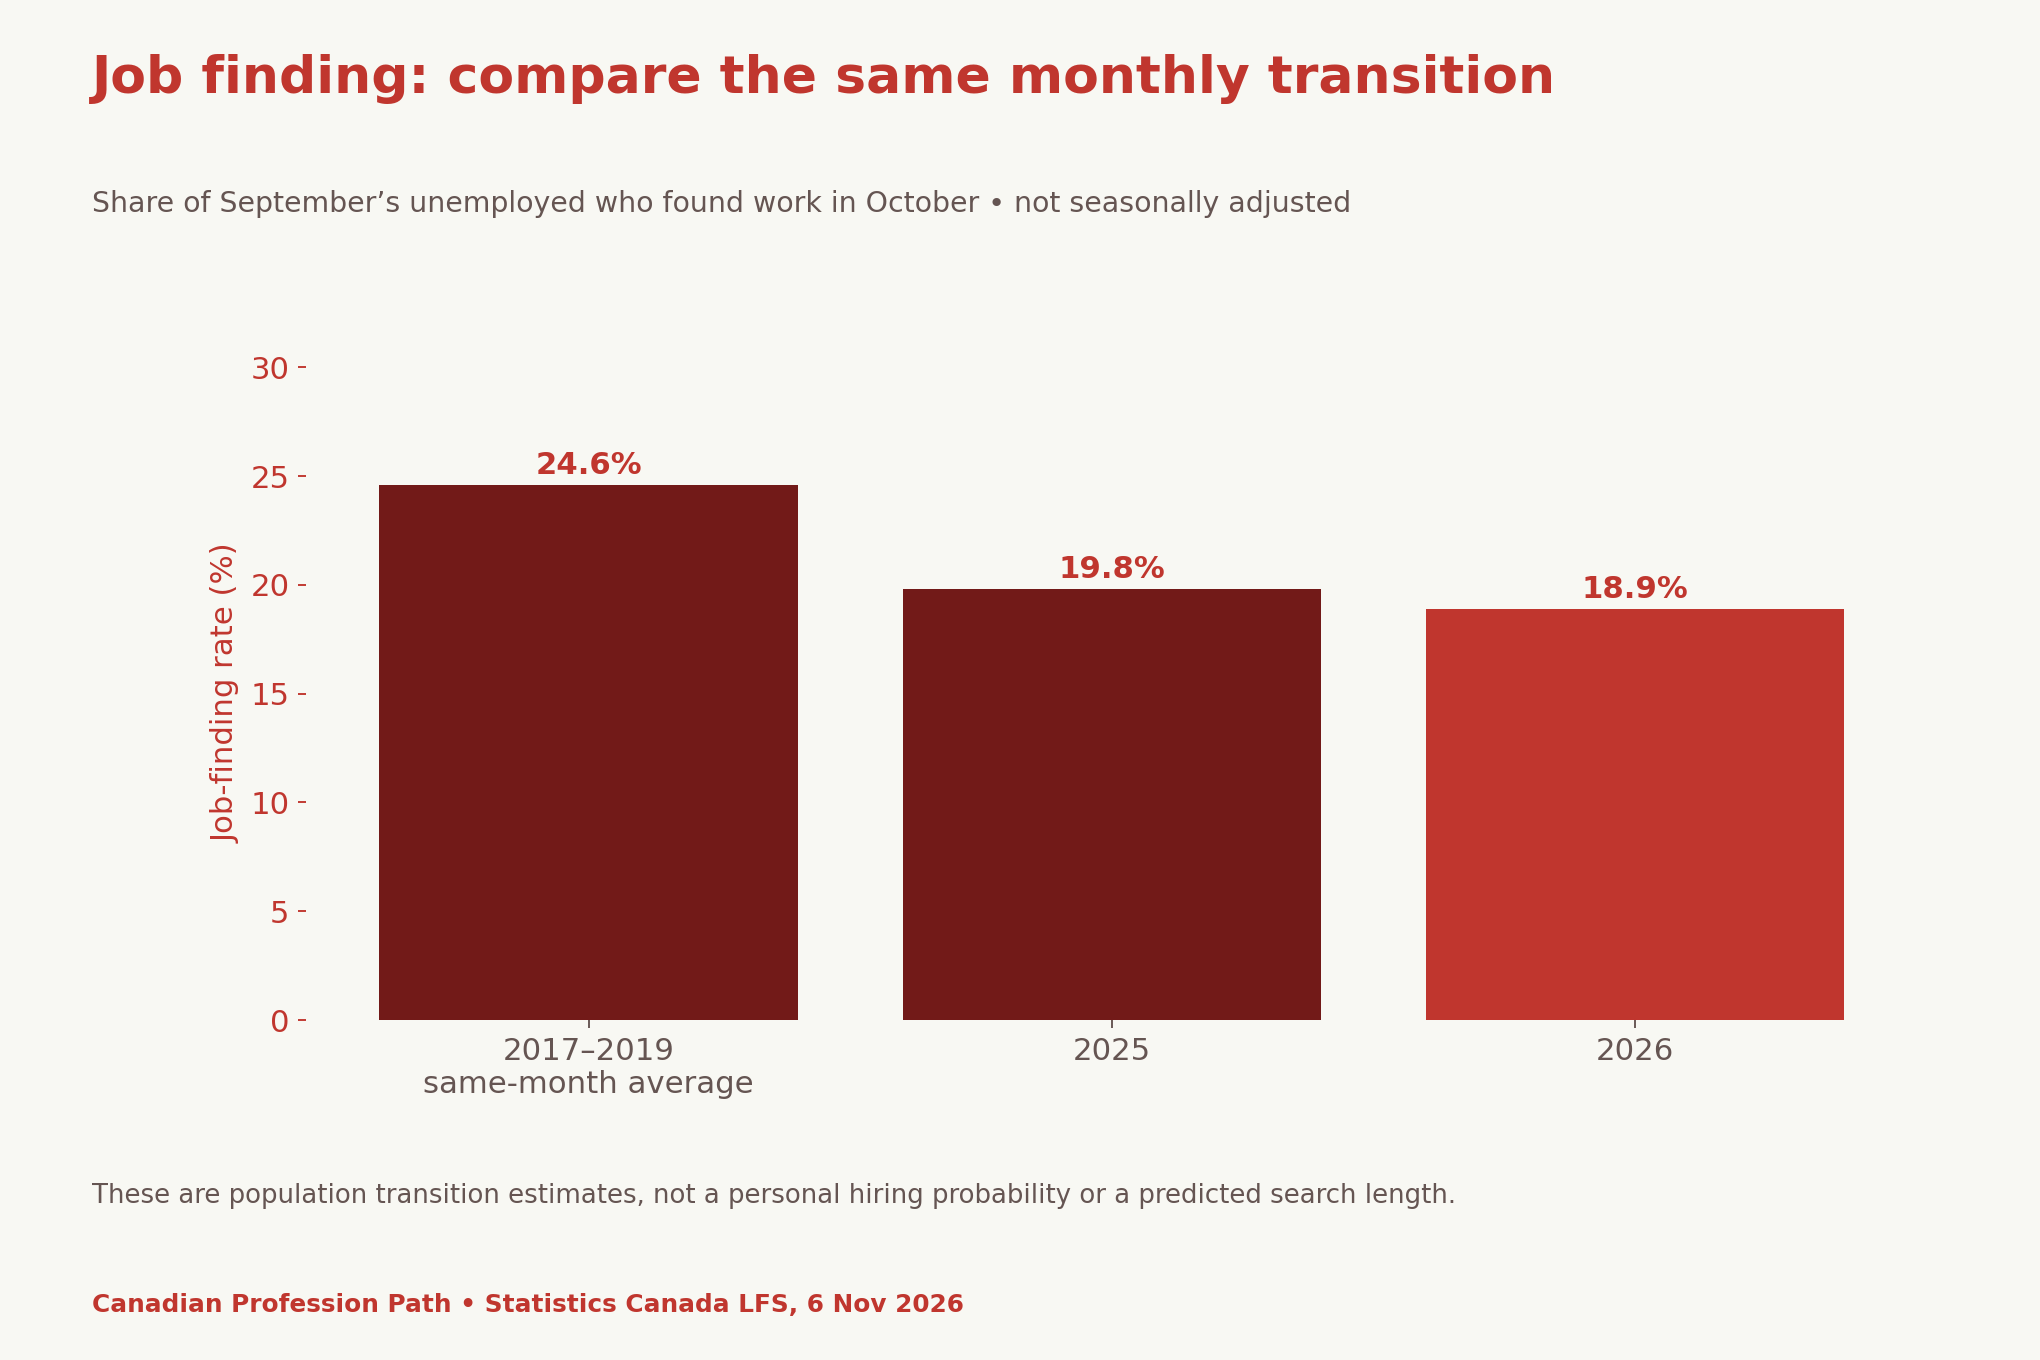
The 2026 estimate is 0.9 percentage points below 2025 and 5.7 points below the pre-pandemic comparison. Those are differences between published estimates. We have not calculated a new confidence interval or tested those differences ourselves. Keep the reference months visible when citing them.
The October survey reference week was 11–17 October. A November release date does not turn these into November observations. Also, a transition rate differs from the unemployment rate: it follows a starting group between states rather than measuring the unemployed share of the labour force at one point.
Why 1 divided by the rate is not your job-search timeline
Taking 1 ÷ 0.189 gives about 5.29. Calling that your expected search length would require assumptions this national figure does not establish. Your chances need not stay constant from one month to another, and your applications are not interchangeable independent trials.
For example, a person waiting for a local licence and a person with an immediate offer face different constraints. Location, duties, experience, availability and employer processes can all matter. A single group rate cannot encode those facts. Nor does it tell you when an employer will respond to a particular application.
Read long-term unemployment as a separate warning signal
The release reports that 23.7% of October’s unemployed had searched continuously for at least 27 weeks. It gives 21.5% a year earlier and 17.2% for the 2017–2019 October average. For October 2026, the within-age-group shares were 15.2% at ages 15–24, 25.3% at 25–54 and 32.7% at 55+. These are separate stock measures, not job-finding rates.
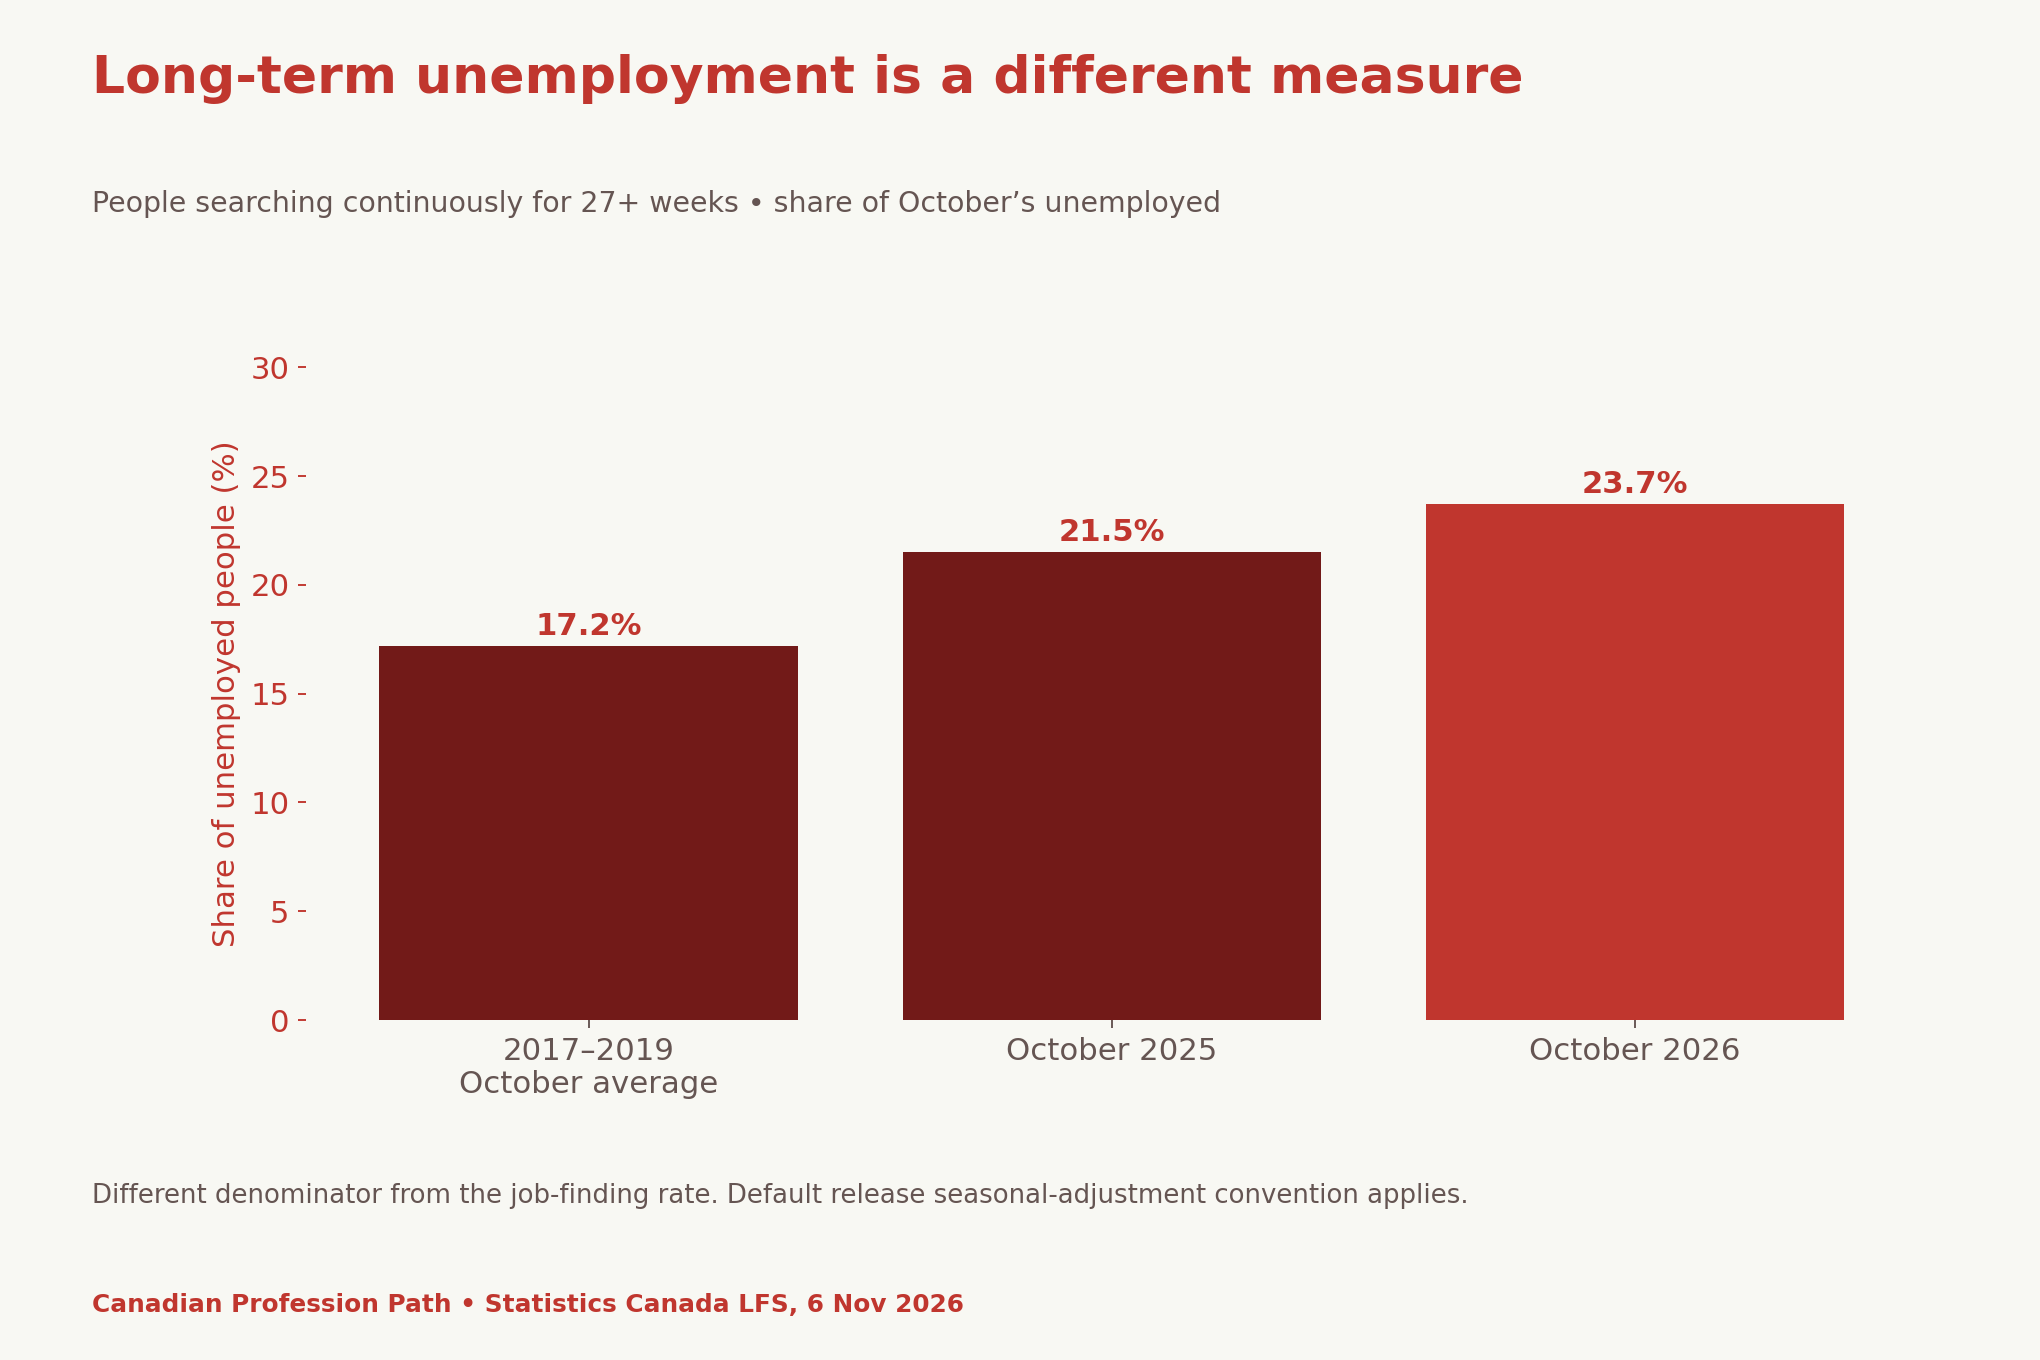
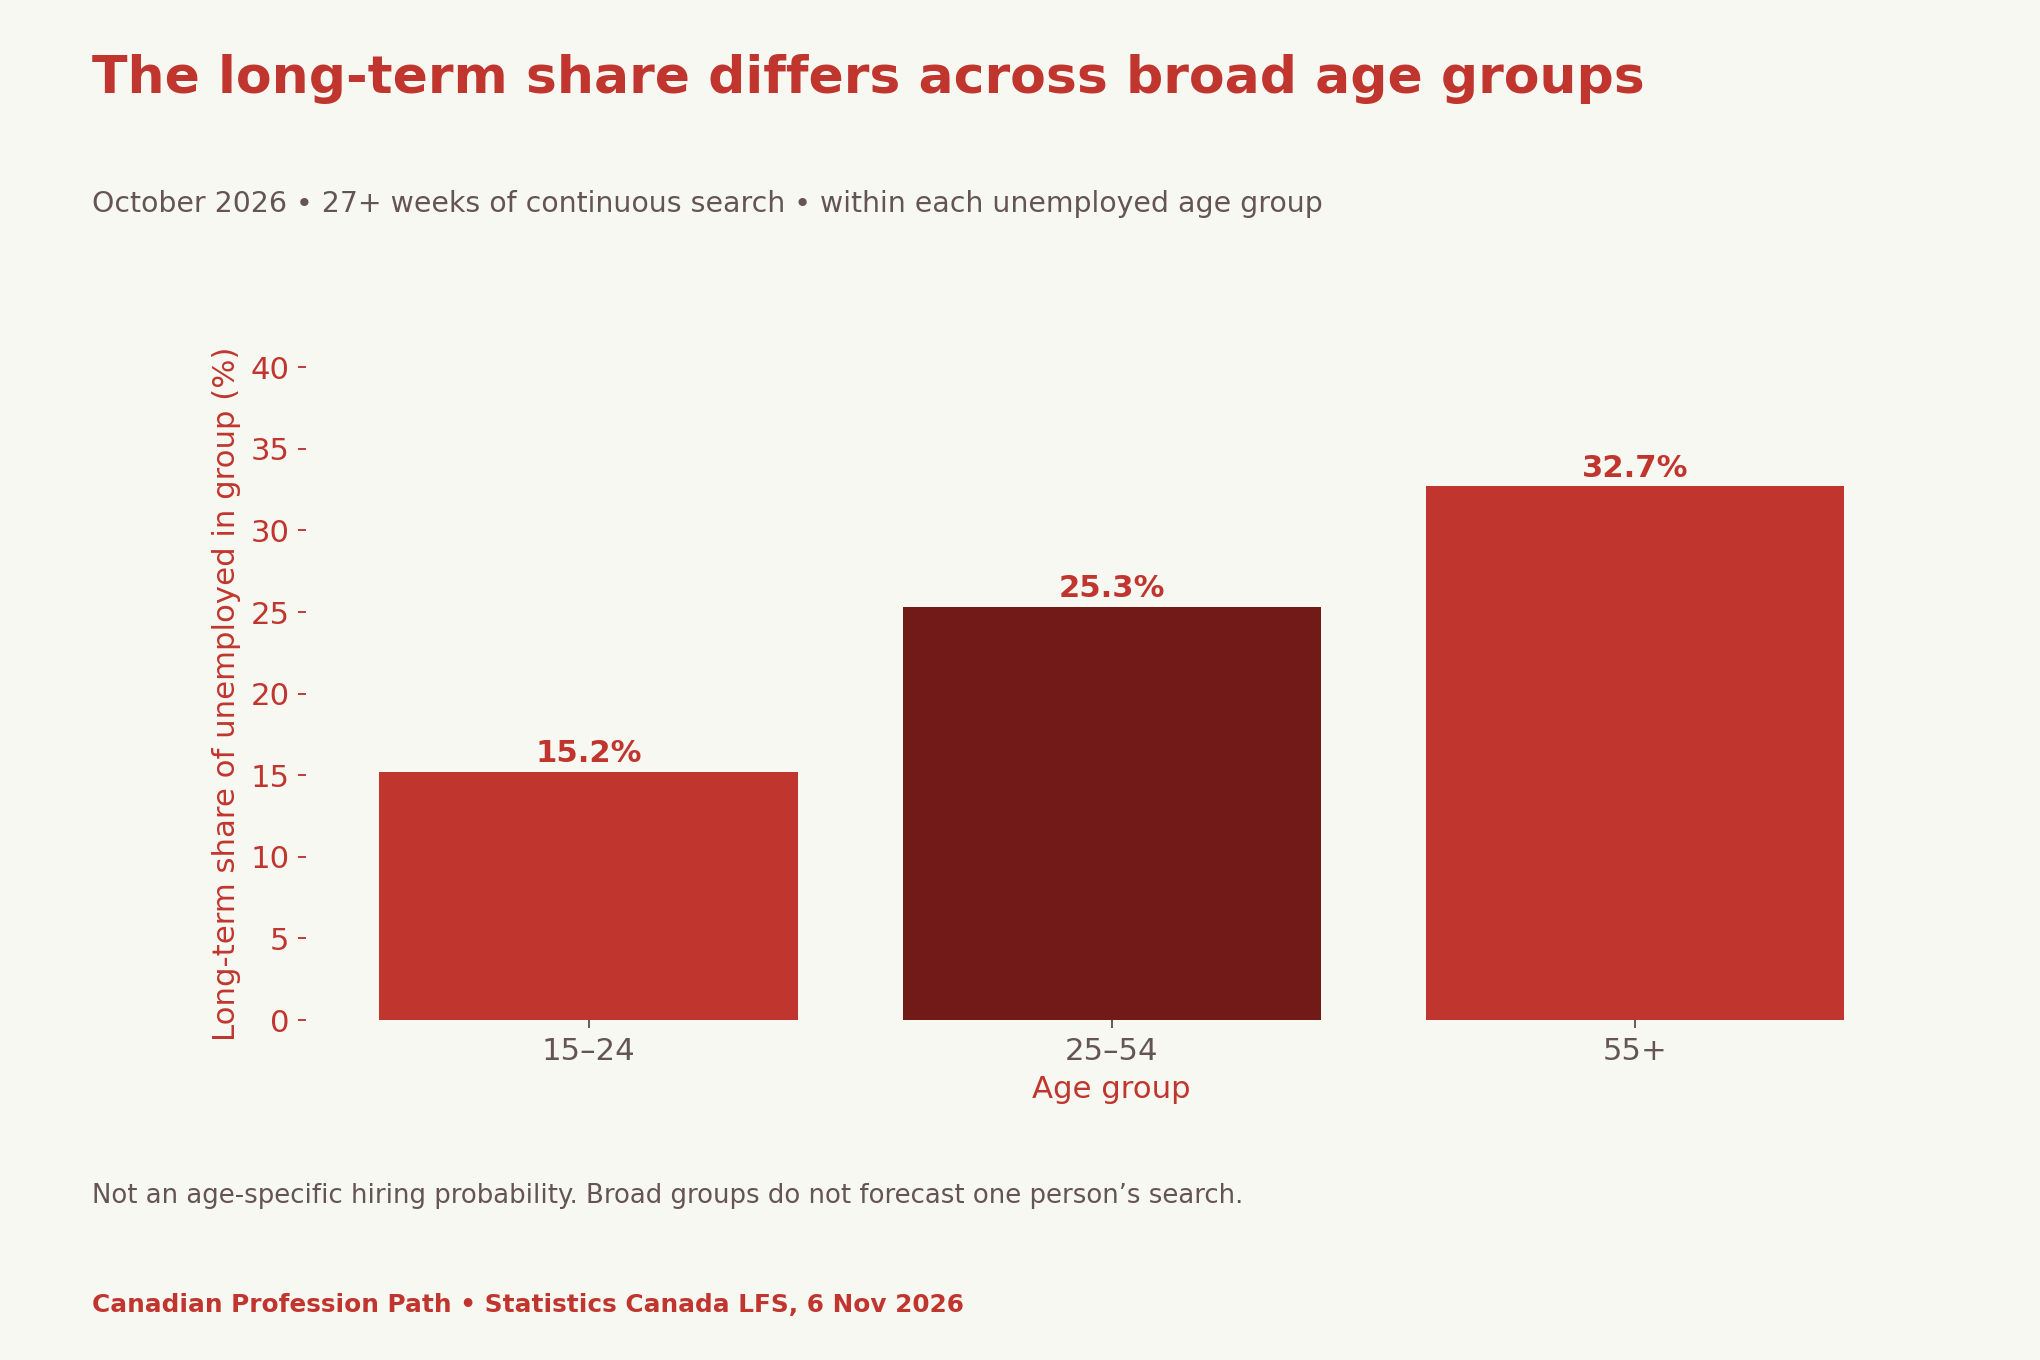
A longer search can be financially and emotionally difficult. However, a person is not a statistical average or a failed application. The useful response is to build support and review points into the plan, rather than treating one national percentage as a verdict on personal effort.
Build a dated application funnel
Start with a private record of roles you could realistically do. Keep a stable application identifier, the employer, source URL, checked date and essential criteria. Record the evidence you used to address those criteria. Then track submission, response, interview, offer and next action separately.
This separates two practical questions. If applications rarely reach an interview, inspect fit and the evidence shown in the application. If interviews occur but offers do not, review examples, role expectations and any useful feedback. Neither pattern proves a single cause. You need enough dated context to choose what to change.
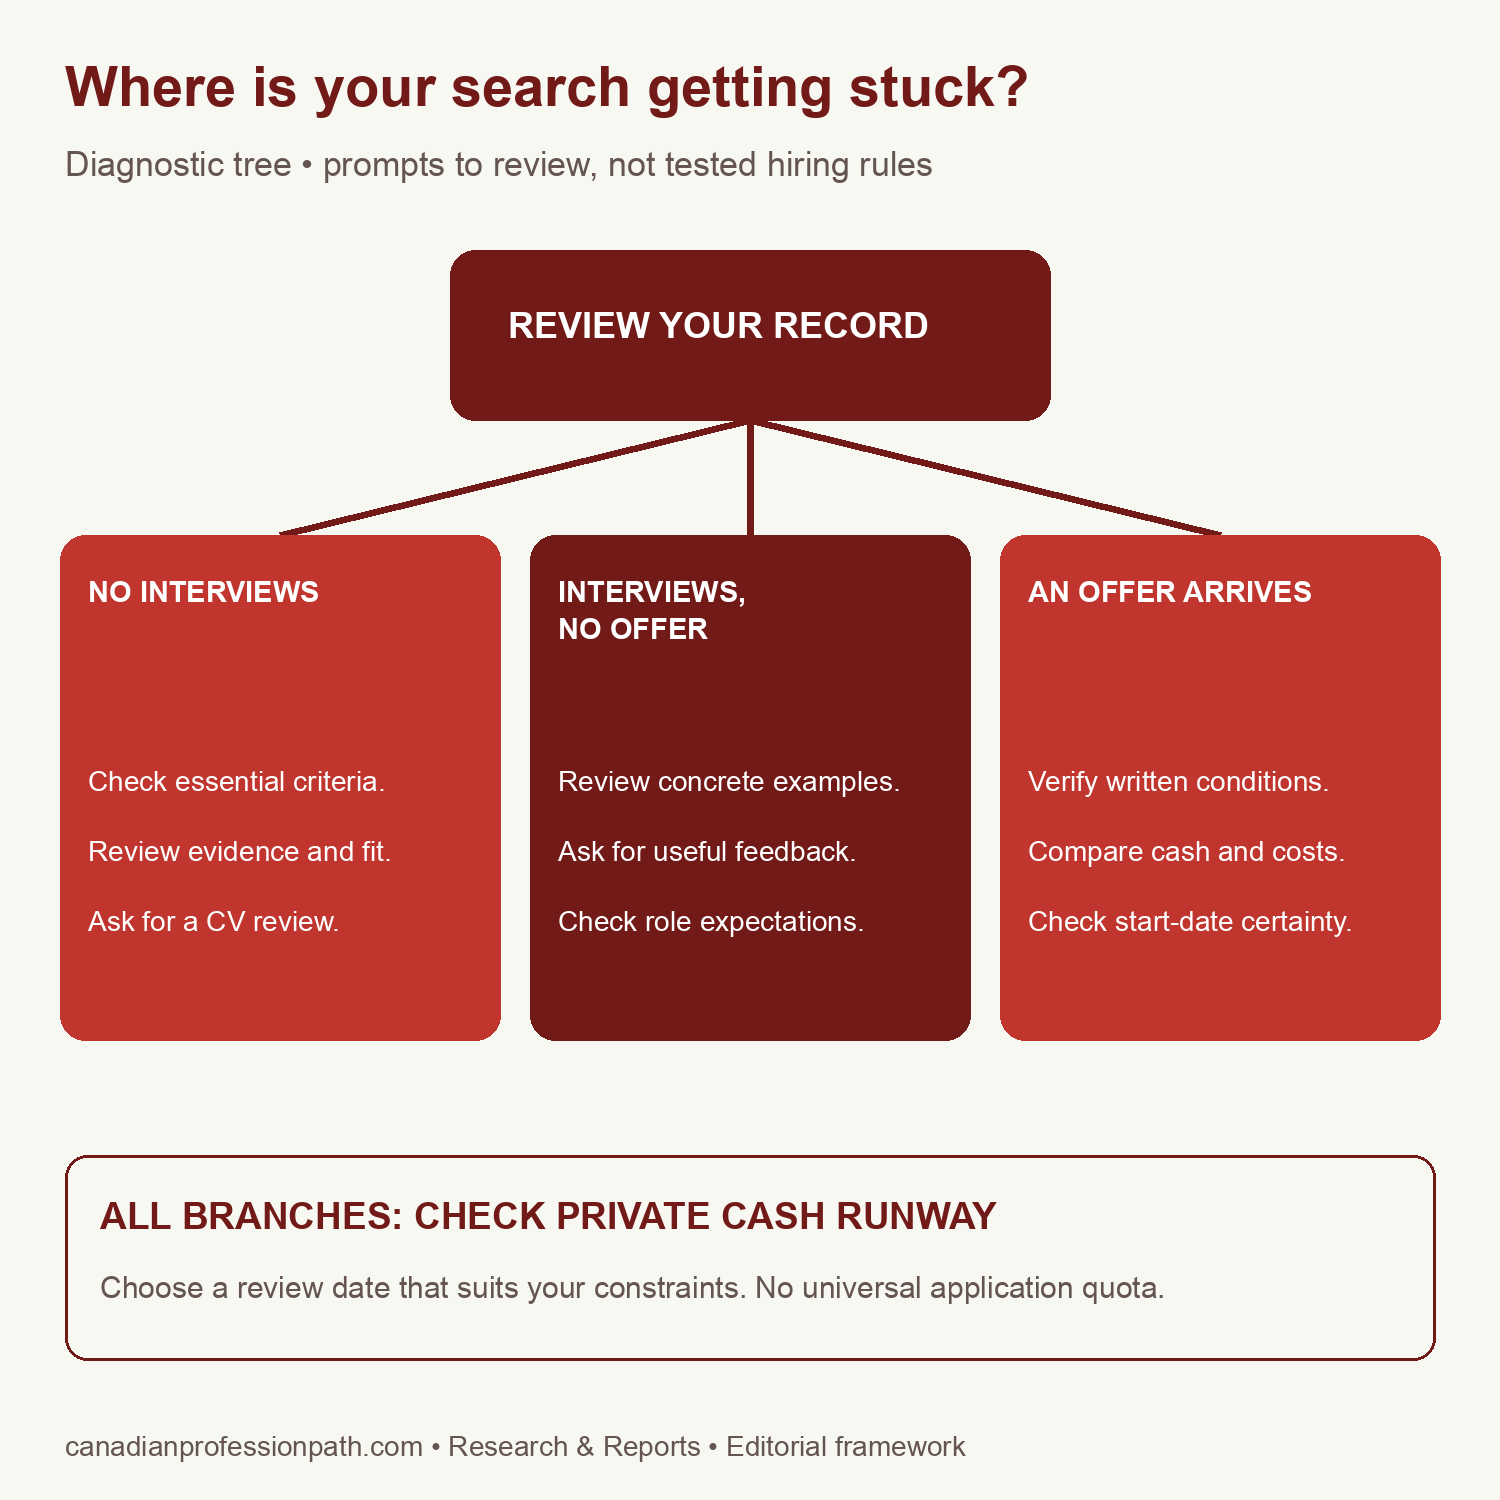
Keep unanswered applications distinct from confirmed rejections. A delayed response may simply be unknown. When you set a review date, consider the actual vacancy deadline and any stated process. Avoid inventing a rule that every applicant must submit the same number of applications each week.
Calculate a private runway without predicting hiring
A basic cash runway divides accessible cash by essential monthly outflow. It can help you see how an expense assumption changes the budget horizon. It does not tell you how long hiring will take. Keep one-off obligations, changing costs and uncertain future income visible outside the simple calculation.
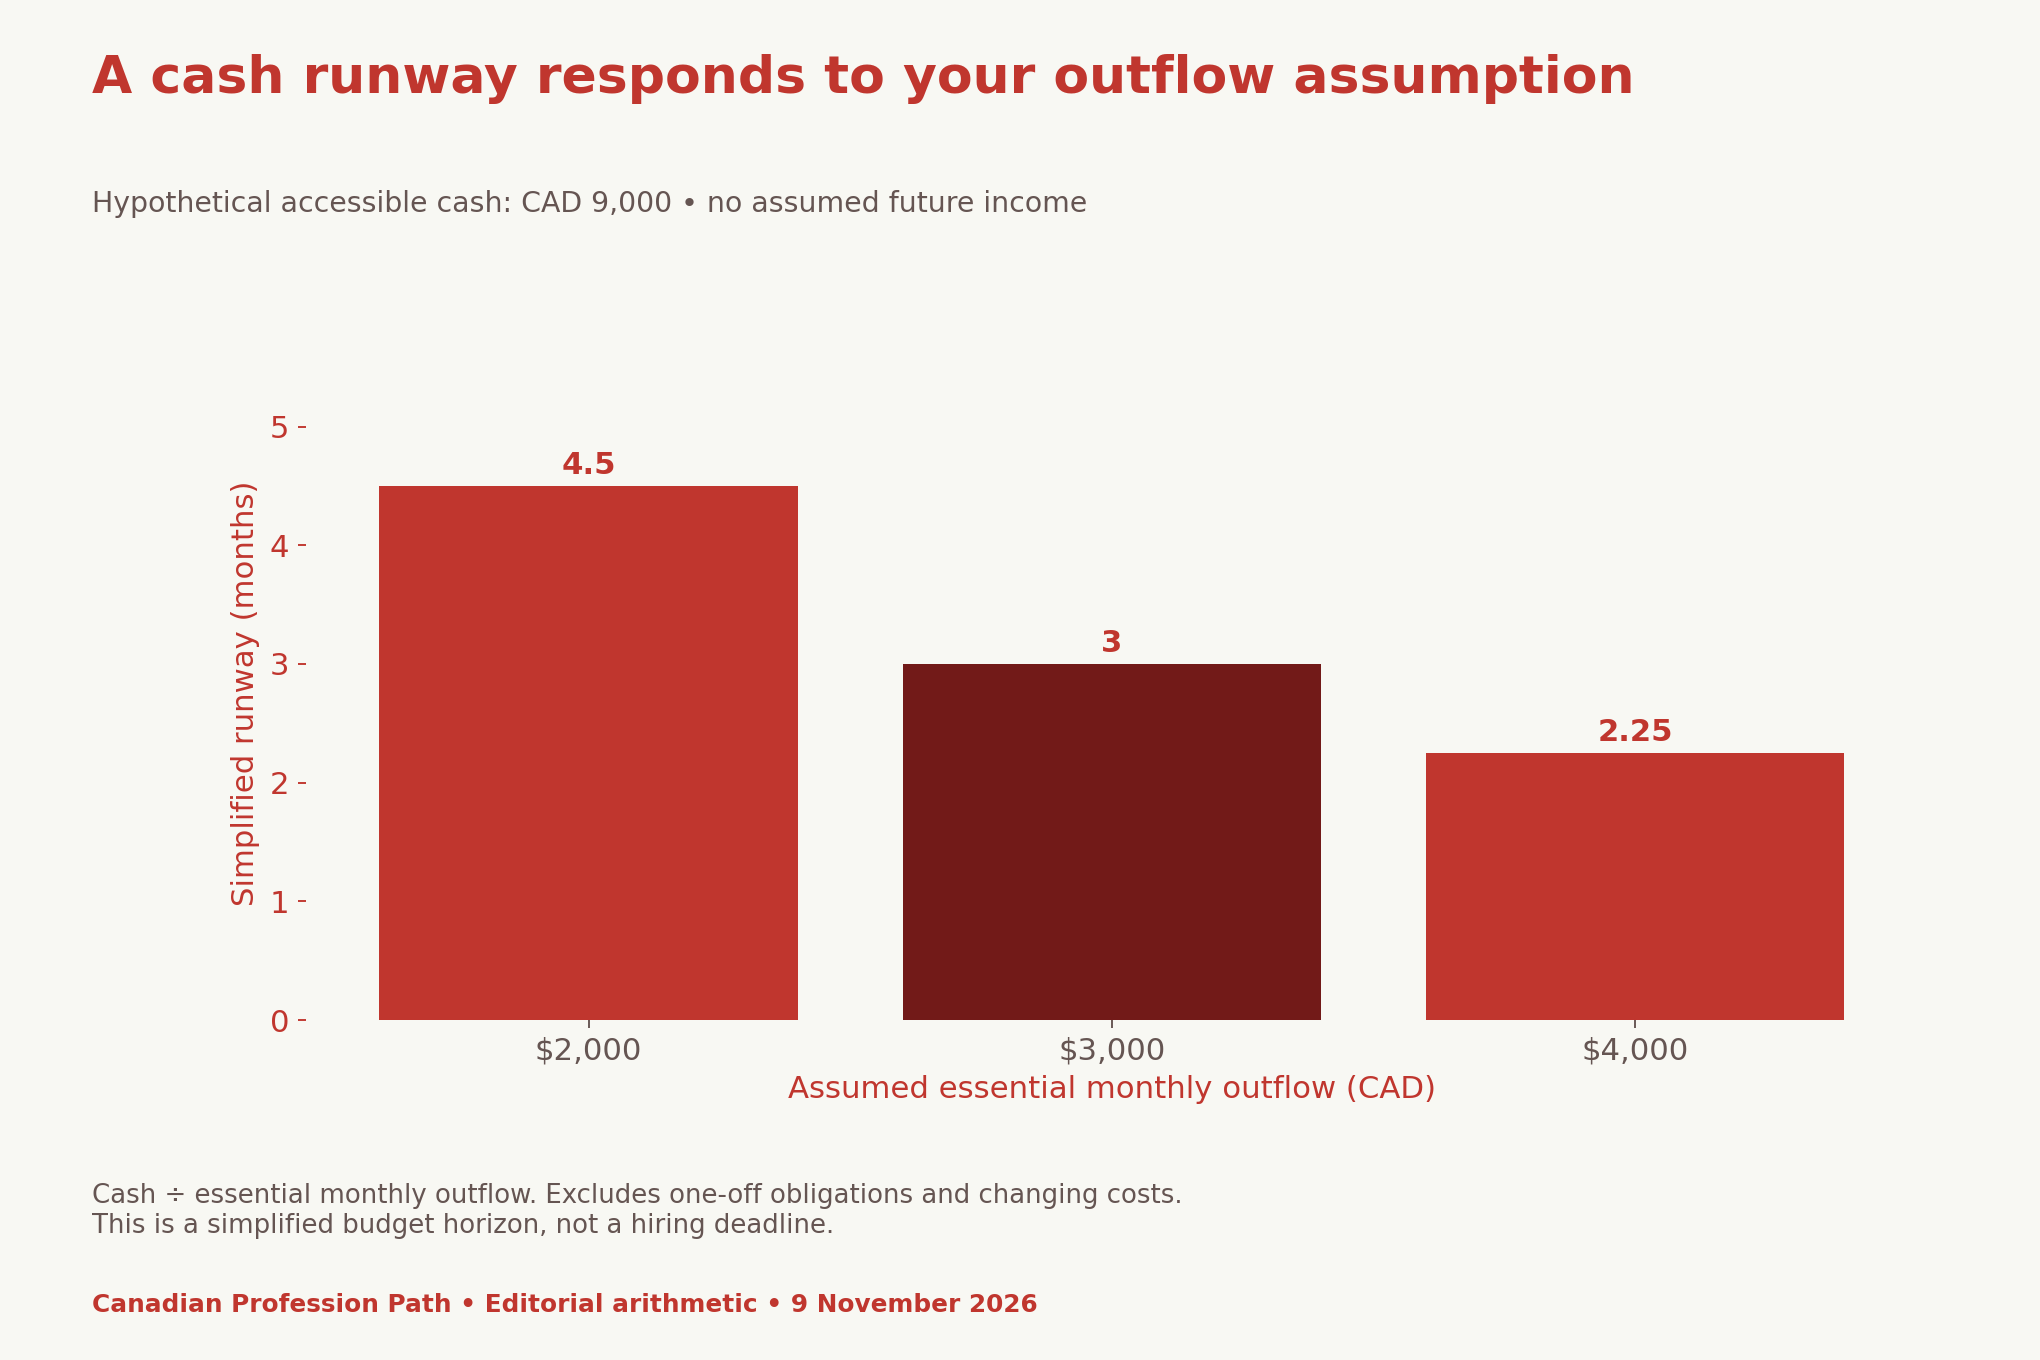
Use your own private figures. Do not count an unconfirmed benefit, loan or future salary as already available cash. Equally, a blank worksheet cell does not mean zero. Check what is known, what remains uncertain and what would require a separate eligibility or financial assessment.
Choose a checkpoint before the budget becomes urgent. At that review, you might broaden a realistic role list, seek application feedback or ask an employment service about local support. The timing is your planning choice. Our guide does not claim that any particular checkpoint or course improves hiring outcomes.
Find support that fits your circumstances
The official Job Bank newcomer resource provides free job-search tools and routes to settlement support. The IRCC service finder can locate funded newcomer services where you meet its eligibility rules; its finder excludes Quebec. Check current eligibility with the provider rather than assuming every resident qualifies.
For Canadian residents who are not eligible for those settlement services, start with public employment resources for your province or territory. Ask what help is available for the particular barrier you face. A support conversation can be useful without a paid course becoming an automatic prerequisite.
When an offer does arrive, a search log is only the beginning of the decision. Our Canadian salary-offer comparison separates guaranteed cash, variable payouts and work costs. For a sector-specific evidence example, see our truck-driver labour-market measures guide. Neither national series establishes your eligibility for a role.
Download the data and private planning tools
The source file preserves measure names, periods, adjustment notes and denominators. Use the blank funnel to record your own search privately. The runway sheet leaves inputs empty, while the scenario file reproduces Figure 4. We do not collect the figures you enter into downloaded files.
- October 2026 job-search source figures and definitions (CSV)
- Blank dated application funnel (CSV)
- Private cash-runway worksheet (CSV)
- Hypothetical runway calculations (CSV)
Methods, boundaries and how to cite
We transcribed the displayed estimates from the dated LFS release, retained its adjustment distinctions, and calculated percentage-point gaps by subtraction. The age chart uses within-group shares. We did not join individual records, estimate personal hiring chances or infer an applicant’s expected duration. The hypothetical runway uses $9,000 divided by each stated monthly outflow.
Survey estimates have sampling uncertainty. Canadian national LFS estimates exclude the territories, and a broad national result need not describe a local occupation. Our original contribution is a transparent planning framework, not a new survey or tested counselling programme. Readers should retain the labels and limitations when reusing the figures.
Suggested citation: Canadian Profession Path (9 November 2026), “Job Search Timeline Canada 2026: Build a Runway, Not a Deadline”, analysis of Statistics Canada’s October 2026 Labour Force Survey, released 6 November. Cite the transition month and denominator, and identify the runway examples as hypothetical.


