







To compare salary offers in Canada, start with base pay and written guarantees, then separate variable cash, work costs and time. A larger headline package can depend on uncertain payouts. ADP’s October 2026 figures make that distinction useful, but they cannot tell you which offer to accept.
Our new research pairs the published payroll measures with an original offer ledger and clearly hypothetical scenarios. The examples are in Canadian dollars. They are planning arithmetic, not observed offers, take-home pay estimates or a forecast of your next raise. Research checked on 9 November 2026.
What October’s base and gross pay figures show
The ADP Canada release dated 5 November 2026 reports median year-over-year base-pay growth of 3.0% for job-stayers and 6.0% for job-changers in October. The corresponding gross-pay figures were 4.5% and 10.4%. These are four group medians, not promised increases for applicants.
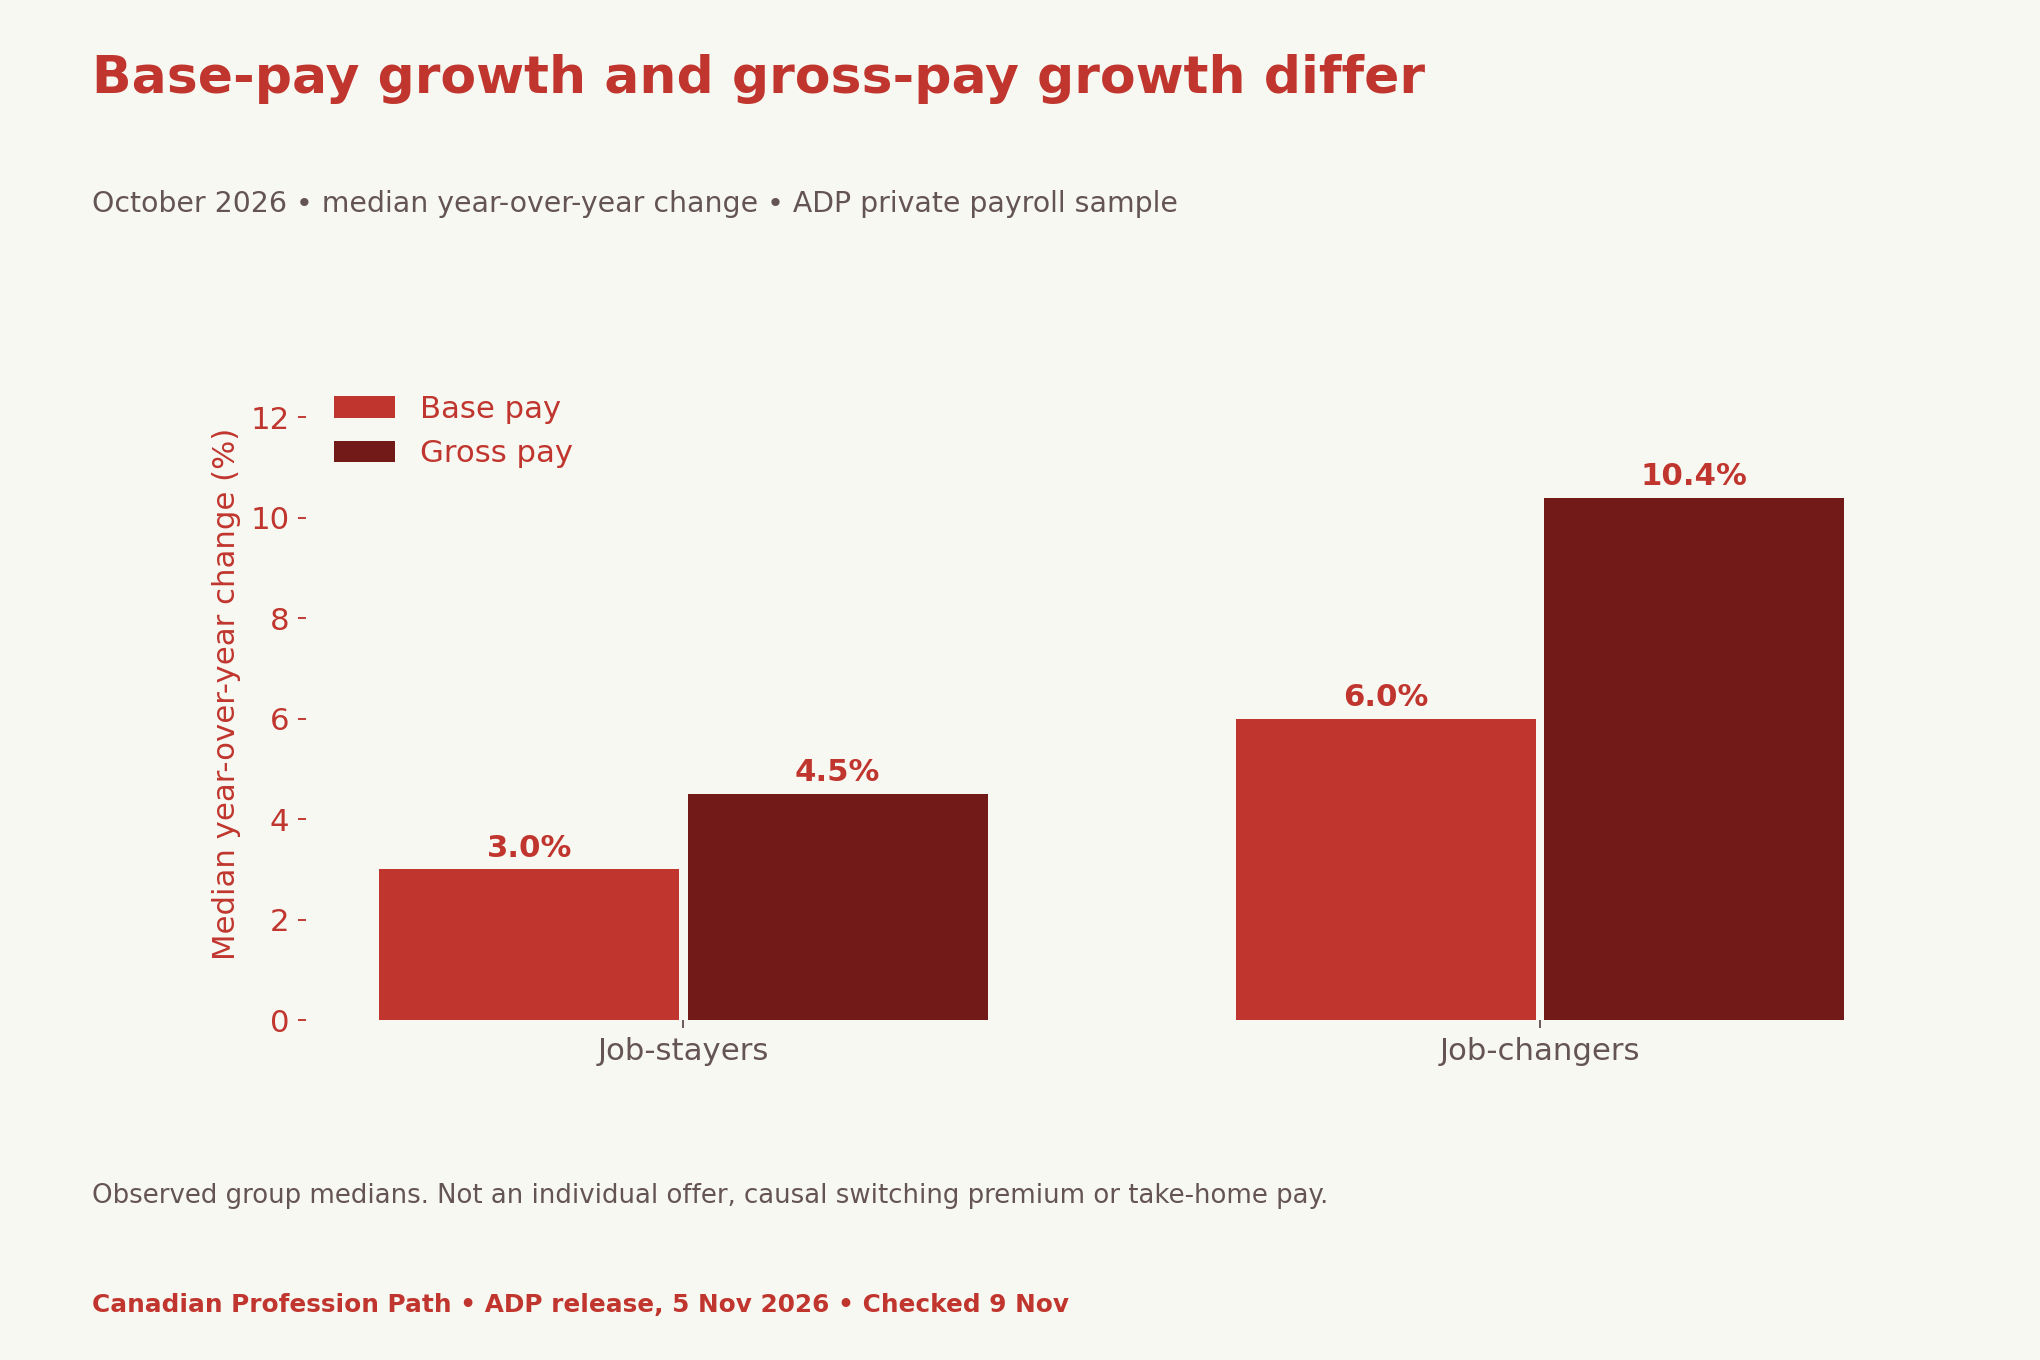
| Worker group | Base-pay growth | Gross-pay growth |
|---|---|---|
| Job-stayers | 3.0% | 4.5% |
| Job-changers | 6.0% | 10.4% |
The difference between changer and stayer medians is 3.0 percentage points for base pay and 5.9 points for gross pay. However, neither difference measures what the same person would earn by switching instead of staying. Selection, jobs and pay arrangements can differ across groups. Do not add either gap to your current salary and call it a likely offer.
Define the pay measure before comparing offers
ADP’s technical notes and FAQ define base pay as the regular pay rate, excluding overtime, tips, bonuses and commissions. Gross pay includes those cash earnings and cash benefits. Base growth compares pay rates; gross growth uses an annual earnings measure that smooths short-term changes. Thus, the two measures do not describe an identical cash-flow window.
The administrative sample covers about 1.6 million workers at ADP’s non-farm private employers. Matching over twelve months produces roughly one million pay-change observations monthly; job-changer reporting uses about 40,000 observations. Those counts describe different parts of the process. This is not a survey of every Canadian worker, and it does not establish what your occupation or employer will pay.
Compare salary offers in Canada with a written ledger
For each offer, record the annual salary or hourly rate and guaranteed paid hours. Keep any explicitly guaranteed cash payment separate from a discretionary target. Note whether the first year is shorter than a full year and whether a payment arrives later. A first-year comparison and an ongoing annual comparison can produce different answers.
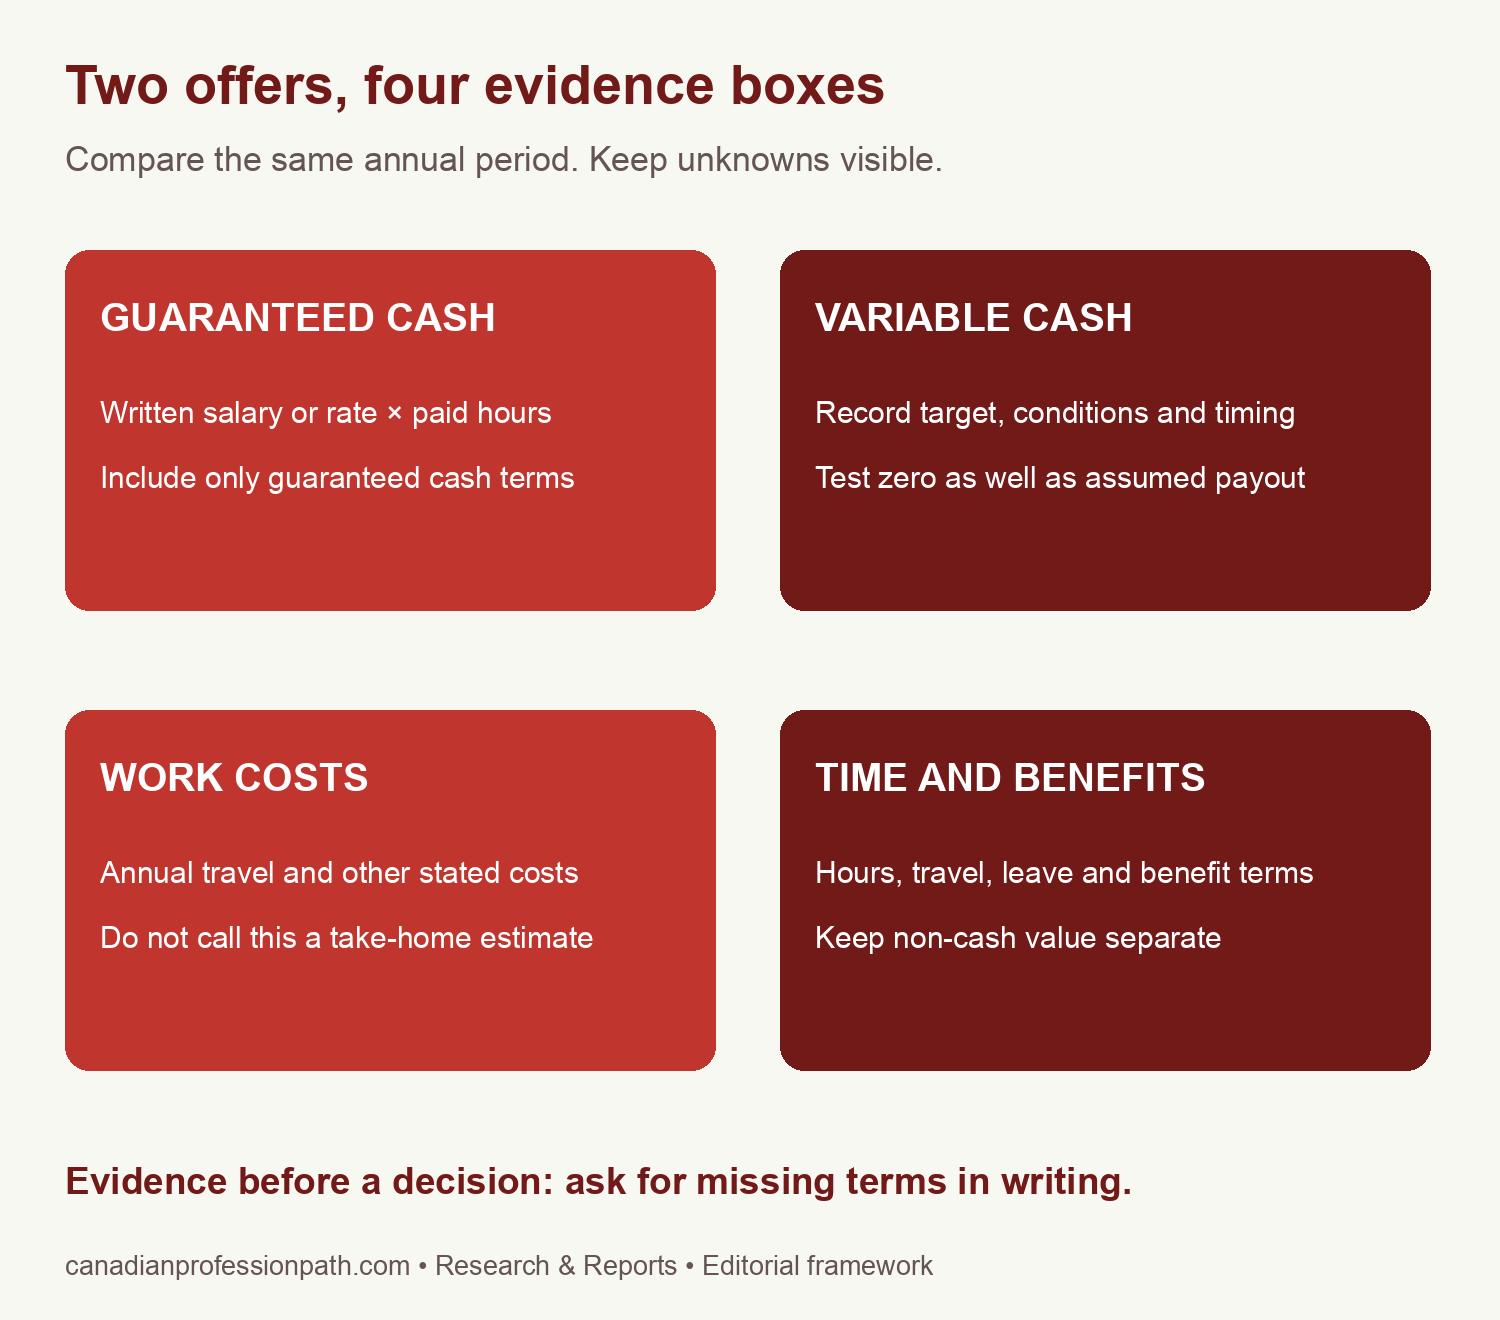
Then list recurring costs using the same annual period: travel, parking or other documented work expenses that differ between options. Use your own figures. Record benefits and pension terms separately rather than converting them to cash without a defensible method. A blank cell means unknown, not zero.
Ask the employer to clarify the written terms for overtime, commissions, bonus conditions, paid hours and leave. Where a contractual restriction needs interpretation, obtain appropriate advice. Our non-compete research guide helps frame that separate evidence question; it does not replace an assessment of your contract.
Stress-test variable pay at zero and at an assumed payout
Consider two hypothetical full-year offers. A guarantees $70,000, has a $2,000 variable target and $3,000 recurring work costs. B guarantees $72,000, has an $8,000 variable target and $6,000 costs. No benefits, pension values, taxes or payroll deductions enter this simplified model.
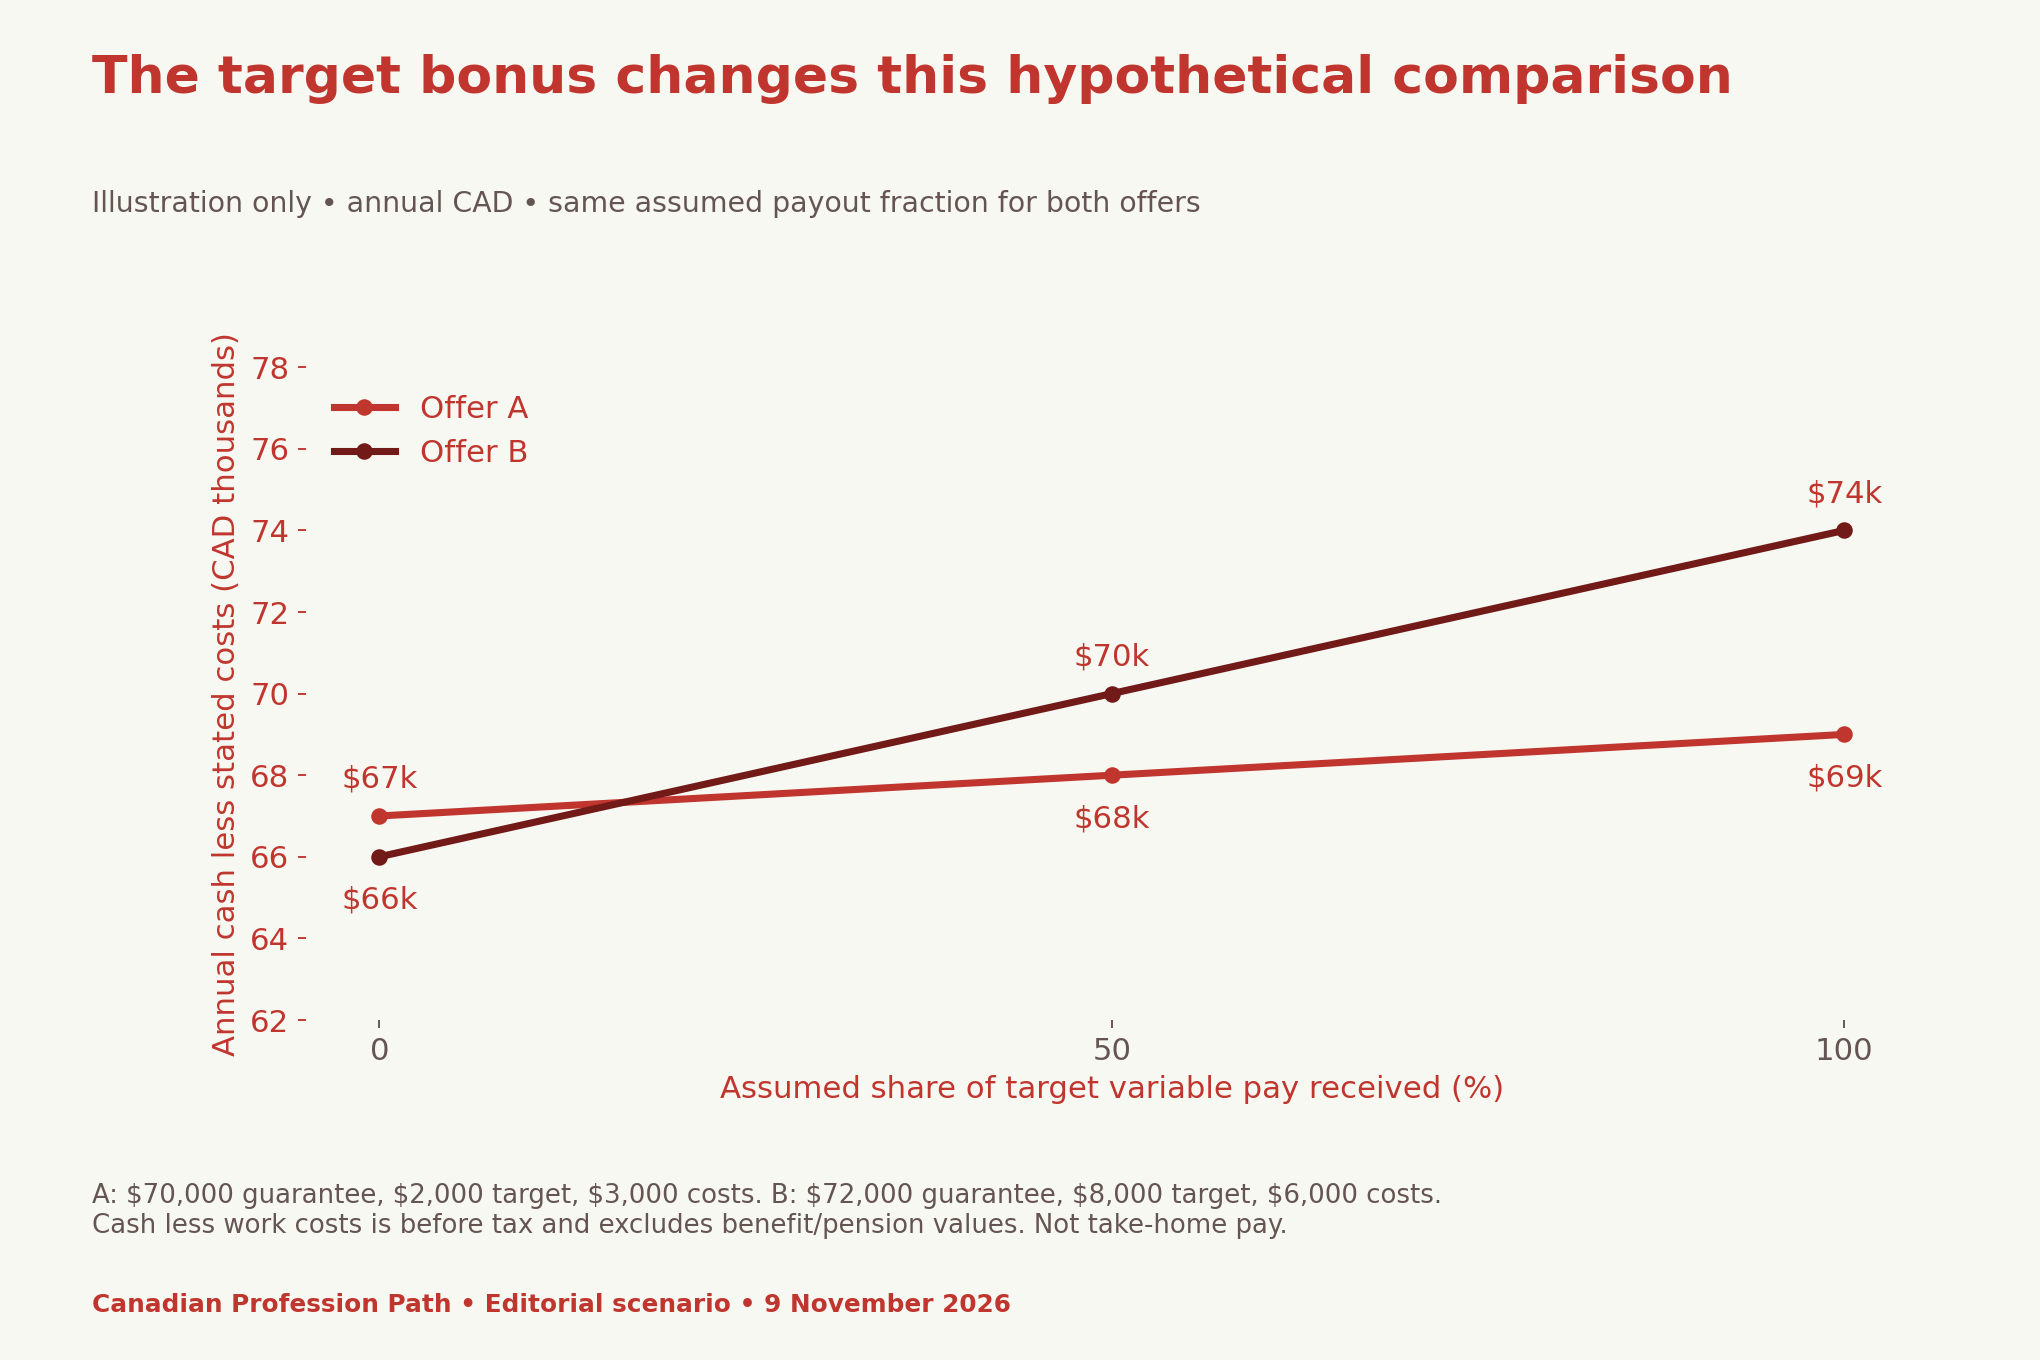
At zero variable payout, A leaves $67,000 before tax and B leaves $66,000 after the stated costs. At full target payout, those figures become $69,000 and $74,000. The ordering changes because the assumptions change. Neither case establishes a probability, an expected value or the better decision for a household.
If you use an expected payout, write down why. A recruiter’s target is not evidence that it will be paid. Also check whether a payment is one-off, delayed or conditional. Keep timing visible even when a simple annual total looks attractive.
Test work costs and time separately
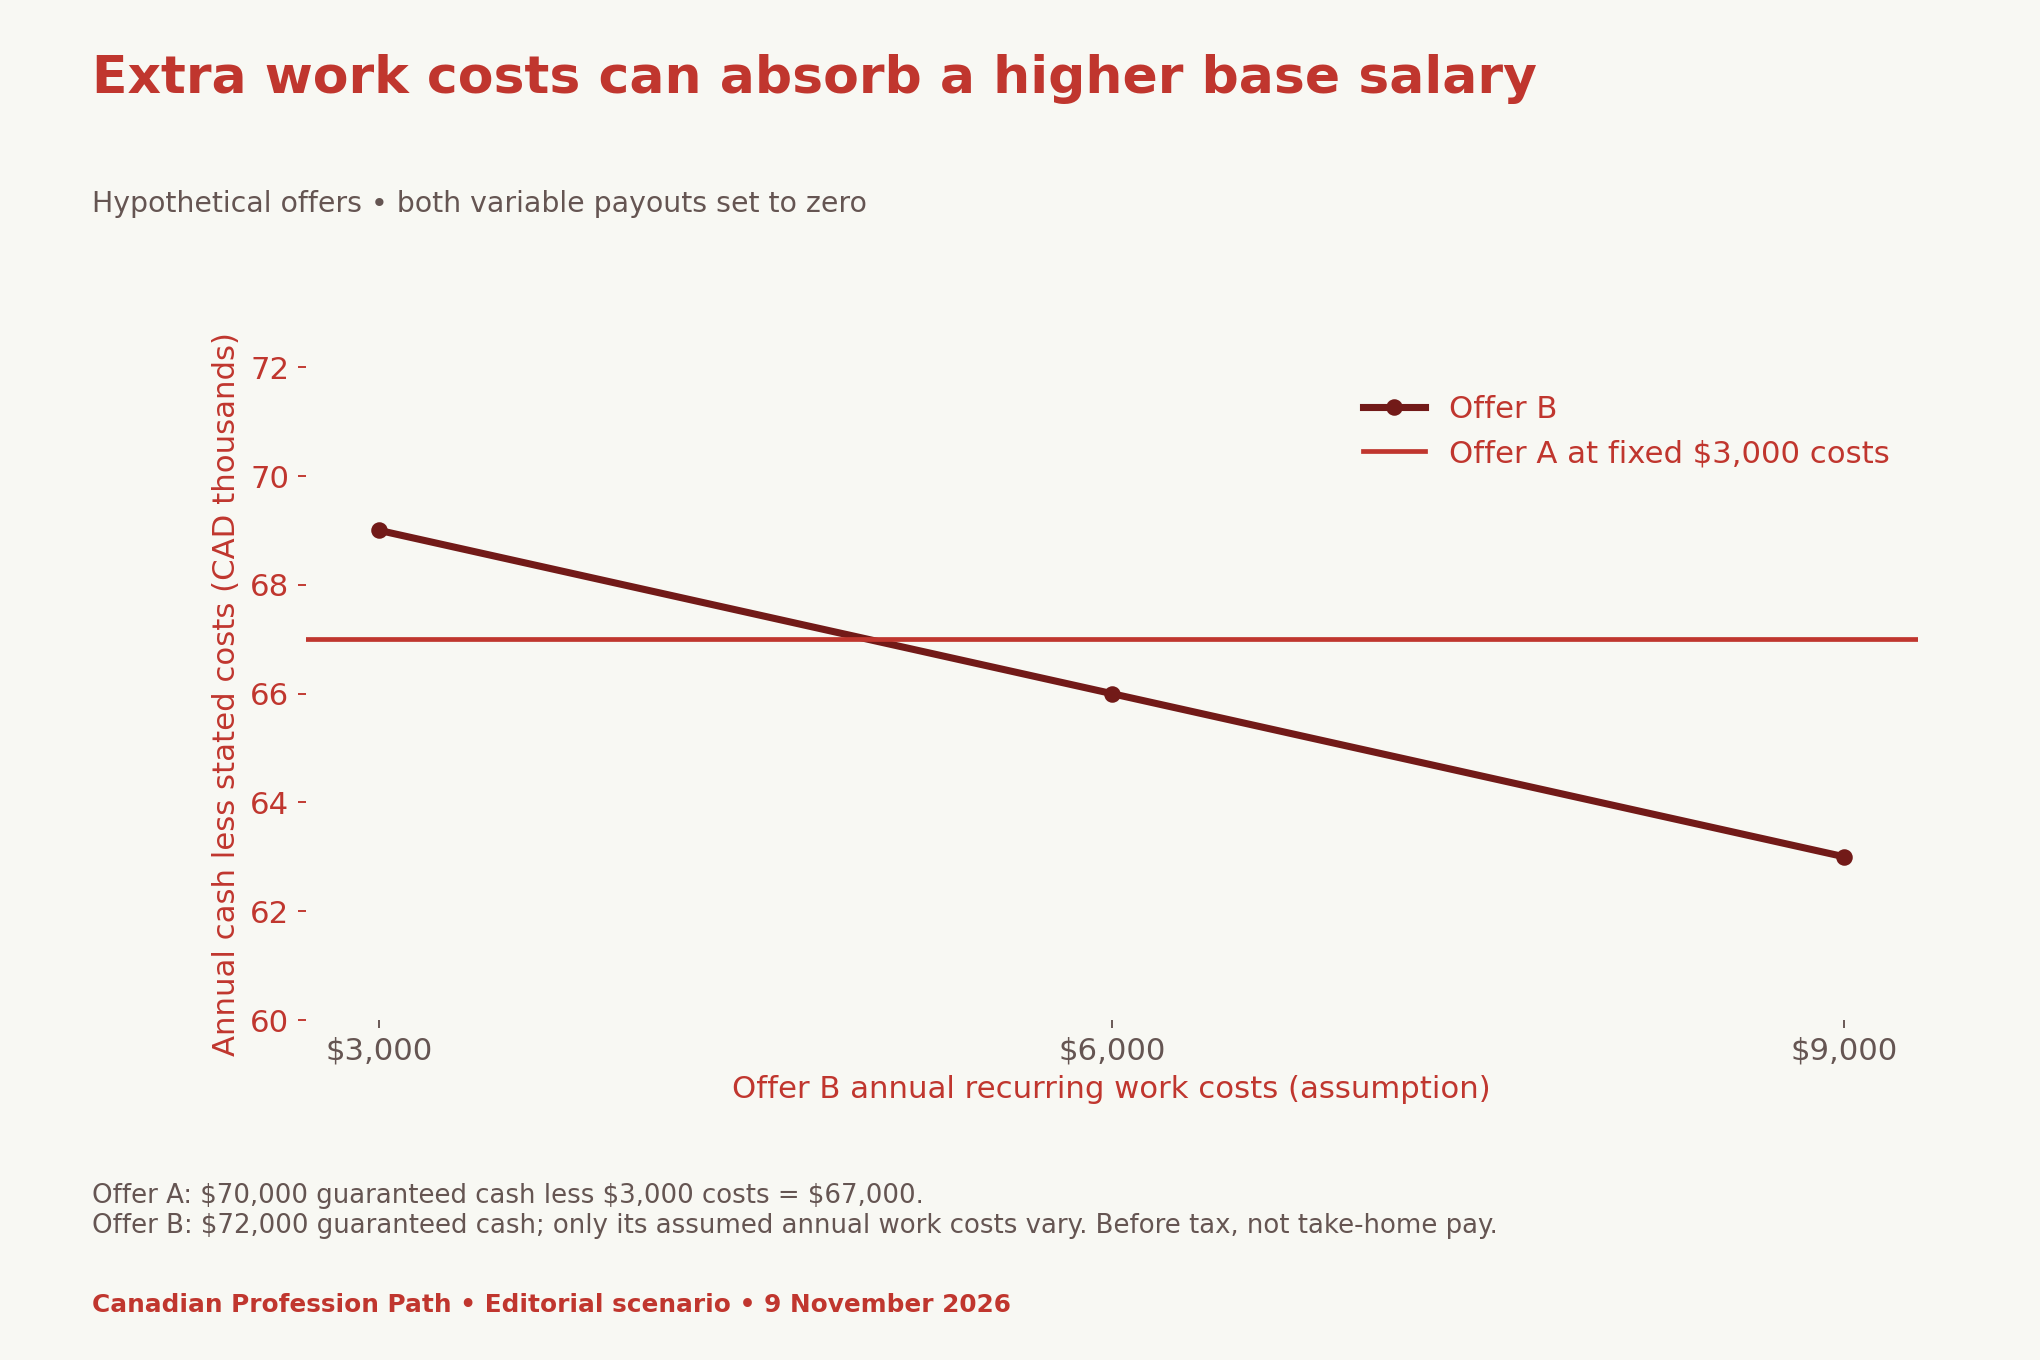
Travel time also matters, even when it has no simple cash price. Record weekly work and commuting hours alongside the annual figures. Someone with care duties may value a predictable schedule differently from another applicant. The worksheet preserves that distinction instead of assigning everyone the same hourly value of free time.
For newcomers, use Canadian-dollar amounts, check whether any credentials or work conditions affect the particular role, and retain evidence for each uncertain item. Job titles alone can hide different duties. Our procurement evidence exercise illustrates how to connect a claimed skill to concrete work rather than a title.
Use the editable comparison calculator
Enter a full-year guarantee, a stated variable target, your assumed payout percentage and annual recurring work costs. The result is guaranteed cash plus assumed variable cash minus stated costs. It excludes tax, deductions and non-cash benefits. It is neither net pay nor a recommendation.
Download the evidence and offer worksheets
The data file preserves the published growth rates and source. A separate scenario file shows the arithmetic used in Figure 2. Use the blank ledger privately; do not publish personal contract or account details. The dictionary explains the boundaries of the measures and model.
- ADP October 2026 source figures (CSV)
- Hypothetical offer scenario calculations (CSV)
- Blank two-offer comparison ledger (CSV)
- Pay measure and model dictionary (CSV)
Methodology, limitations and citation
We transcribed the four October figures from ADP’s 5 November release and checked their definitions against the technical notes. We calculated differences by subtraction, in percentage points. The scenario calculations use stated editorial inputs only. No employer offers were sampled, no workers were surveyed and no switching effect was estimated.
The national payroll evidence cannot rank local vacancies or predict individual income. The examples exclude inflation, taxes, deductions, pension valuation and benefit valuation. Real offers may require a first-year cash-flow comparison and specialist advice. The tools have not been tested for improving negotiation or employment outcomes.
Suggested citation: Canadian Profession Path (9 November 2026), “Compare Salary Offers Canada: Base Pay, Gross Pay and Work Costs”, using ADP Canada’s October 2026 Pay Insights, released 5 November 2026. When reusing a chart, retain its period, coverage and distinction between observed data and hypothetical scenarios.


