






Checking secondary teaching career prospects in Canada in 2026 starts with a distinction: more students in a grade group do not automatically mean a vacancy in your subject. A new Statistics Canada release describes an earlier school year. Use that evidence to choose local questions before committing to teacher education, extra qualifications or relocation.
Our report analyses six years of cohort counts, reconciles two differently scoped growth figures and provides a board-research worksheet. Three charts and an evidence-ladder infographic keep enrolment separate from staffing and certification. We do not estimate placement, pay or retirement openings. Research checked on 9 November 2026.
Read the school year before the release year
The release published on 4 November 2026 concerns 2024/2025. It is not a count of students or teaching vacancies in the current school year. Its public-school headline is approximately 5.5 million students, while its regular youth programme detail places grades 10–12 at approximately 1.2 million.
The survey counts students at the beginning of the school year, in September or as close as possible thereafter. The 2024/2025 survey instrument separates programme types and grades. That matters when two totals look similar but cover different populations. A useful career decision needs the year and population beside every figure.
Secondary teaching career prospects in Canada in 2026: start with cohorts
The release reports 3.6% growth in grades 10–12 enrolment and a 1.1% decline in junior kindergarten and kindergarten. Both concern public regular programmes for youth. We downloaded Table 37-10-0007-01 and reproduced those rounded changes from its grade counts.
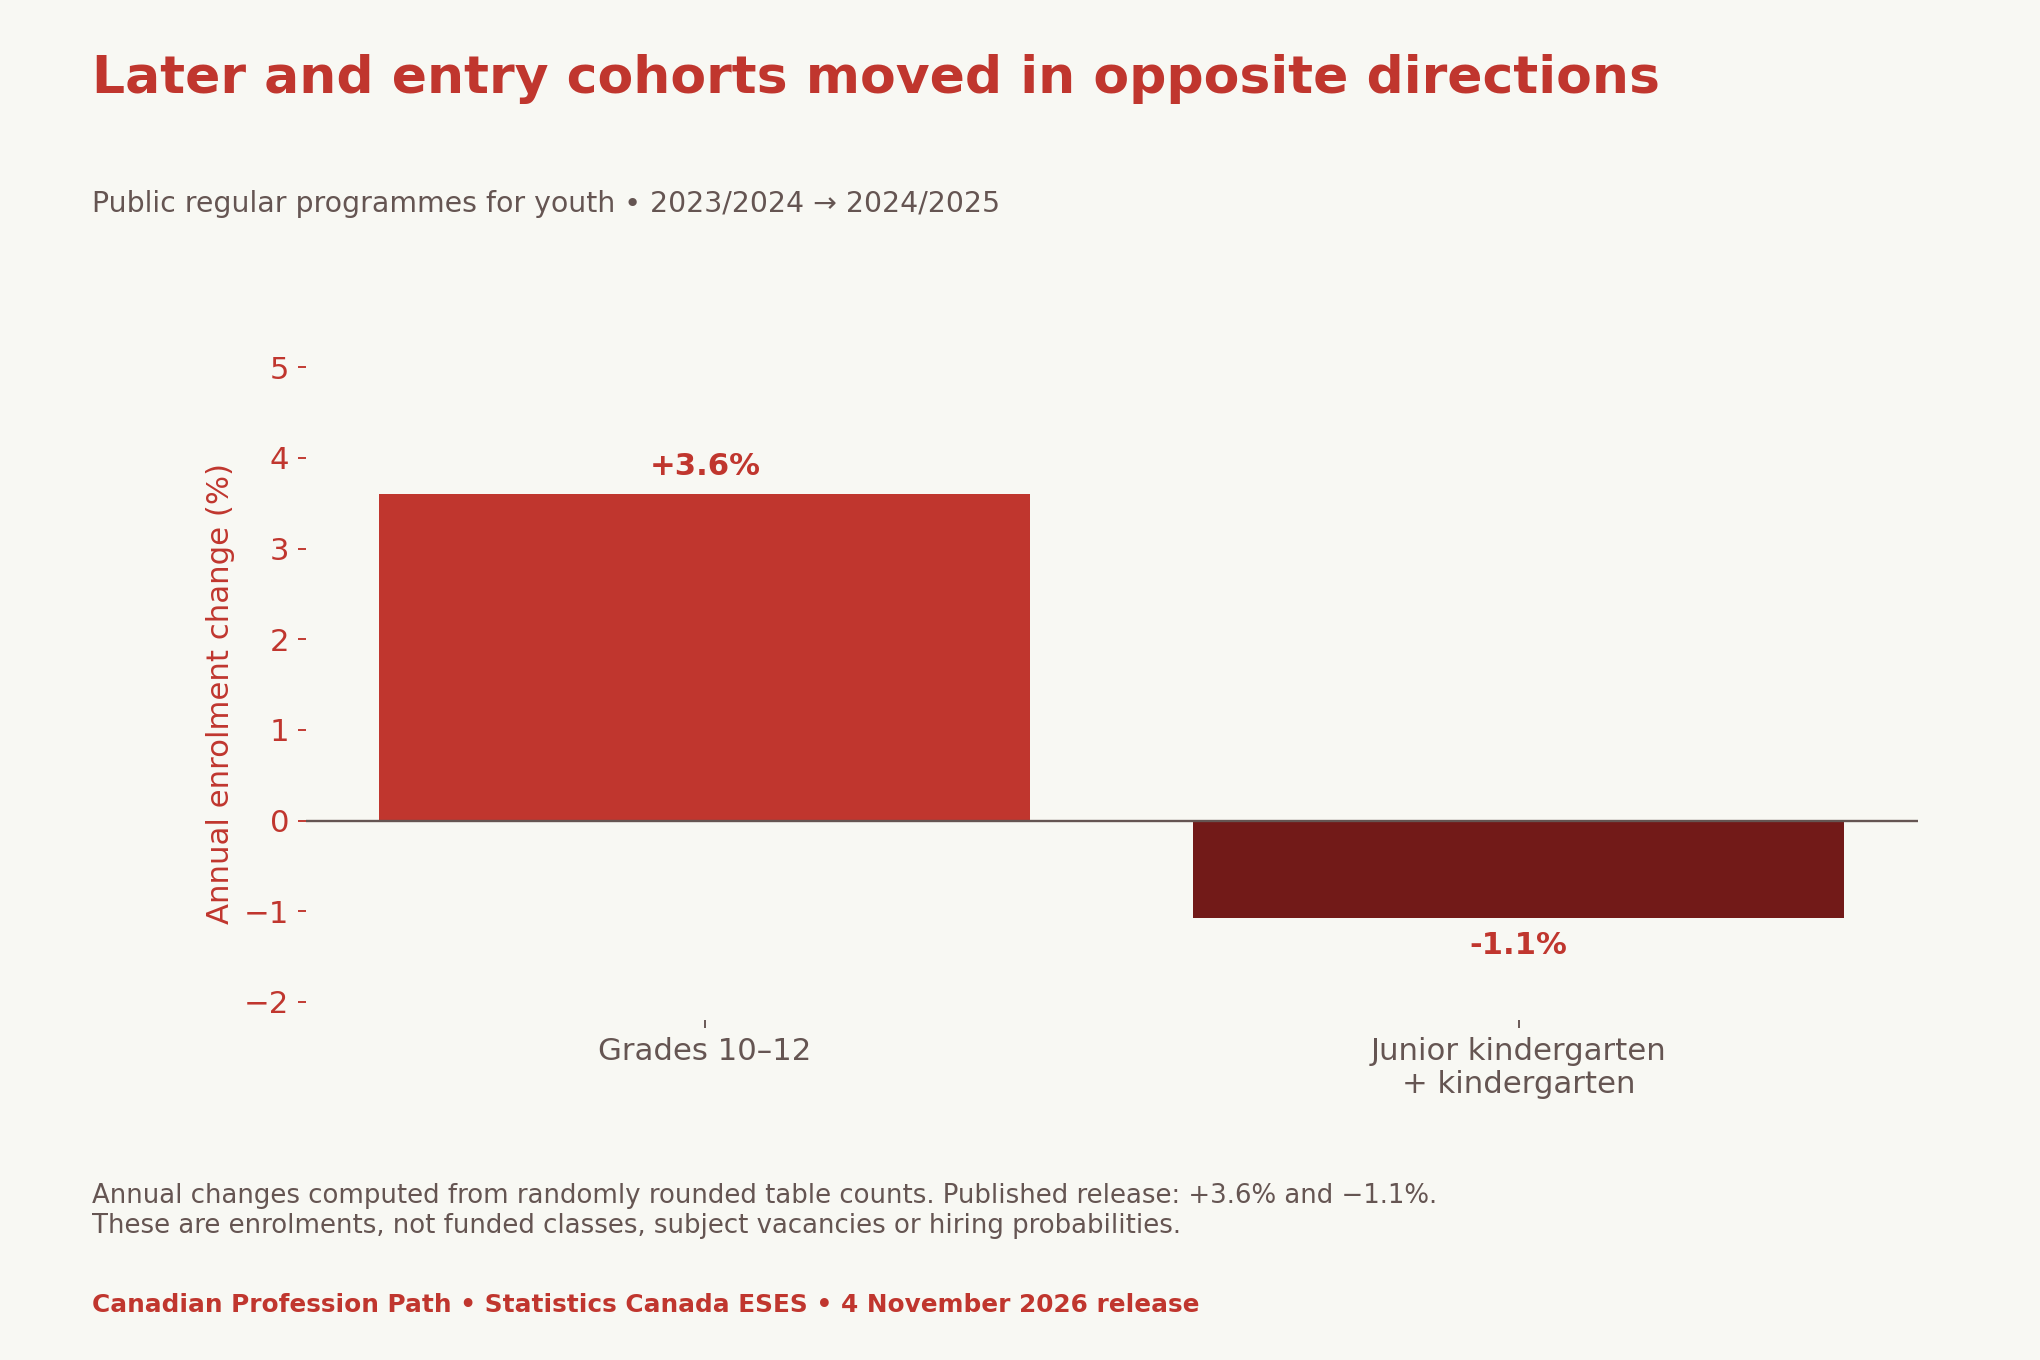
The downloaded grade rows sum to 1,194,111 students in grades 10–12 in 2024/2025, compared with 1,152,627 a year earlier. Junior kindergarten plus kindergarten totals are 514,800 and 520,377. These sums use randomly rounded published cells, so they should not be presented as unrounded administrative headcounts.
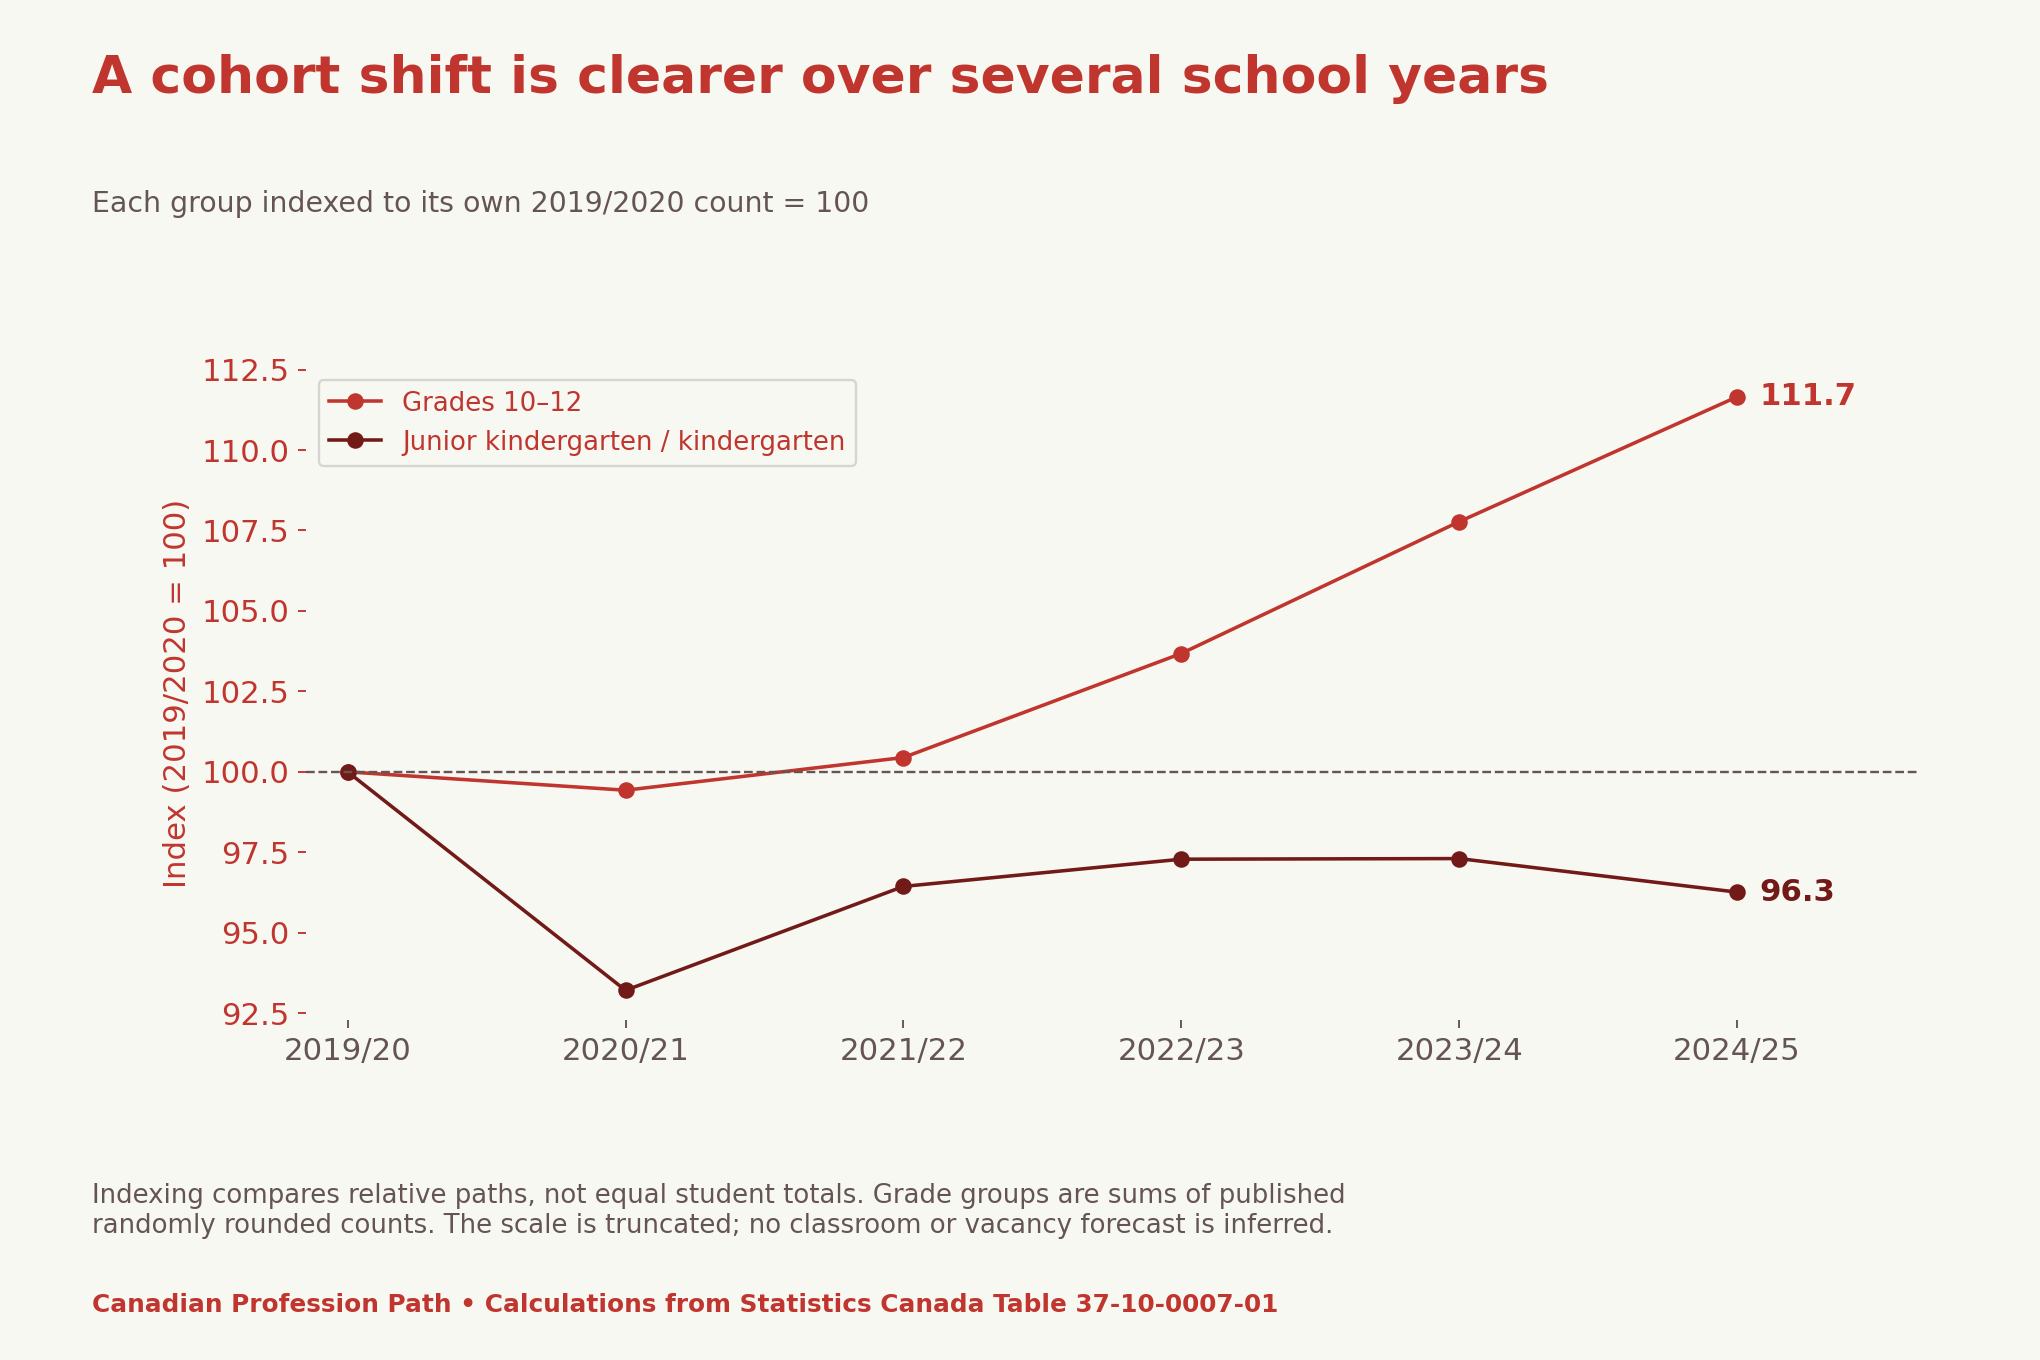
This is a descriptive cohort comparison. It does not identify a single cause for the changes or show where an individual should train. Local migration, progression, completion patterns and school decisions can matter. No board or province is ranked here, because a fair ranking requires comparable local series and current staffing evidence.
Resolve the 1.6% and 1.4% growth figures by programme scope
The release’s opening section reports 1.6% public-school growth. Its grade discussion later refers to 1.4% overall growth without repeating the programme qualification. We checked Table 37-10-0109-01 rather than treating the numbers as interchangeable.
All public-school programmes rose from 5,456,451 in 2023/2024 to 5,542,761 in 2024/2025, a calculated 1.58%, or 1.6% rounded. Public regular youth programmes rose from 5,155,428 to 5,229,759, a calculated 1.44%, or 1.4% rounded. The underlying table therefore supports different programme scopes, rather than one universal growth rate.
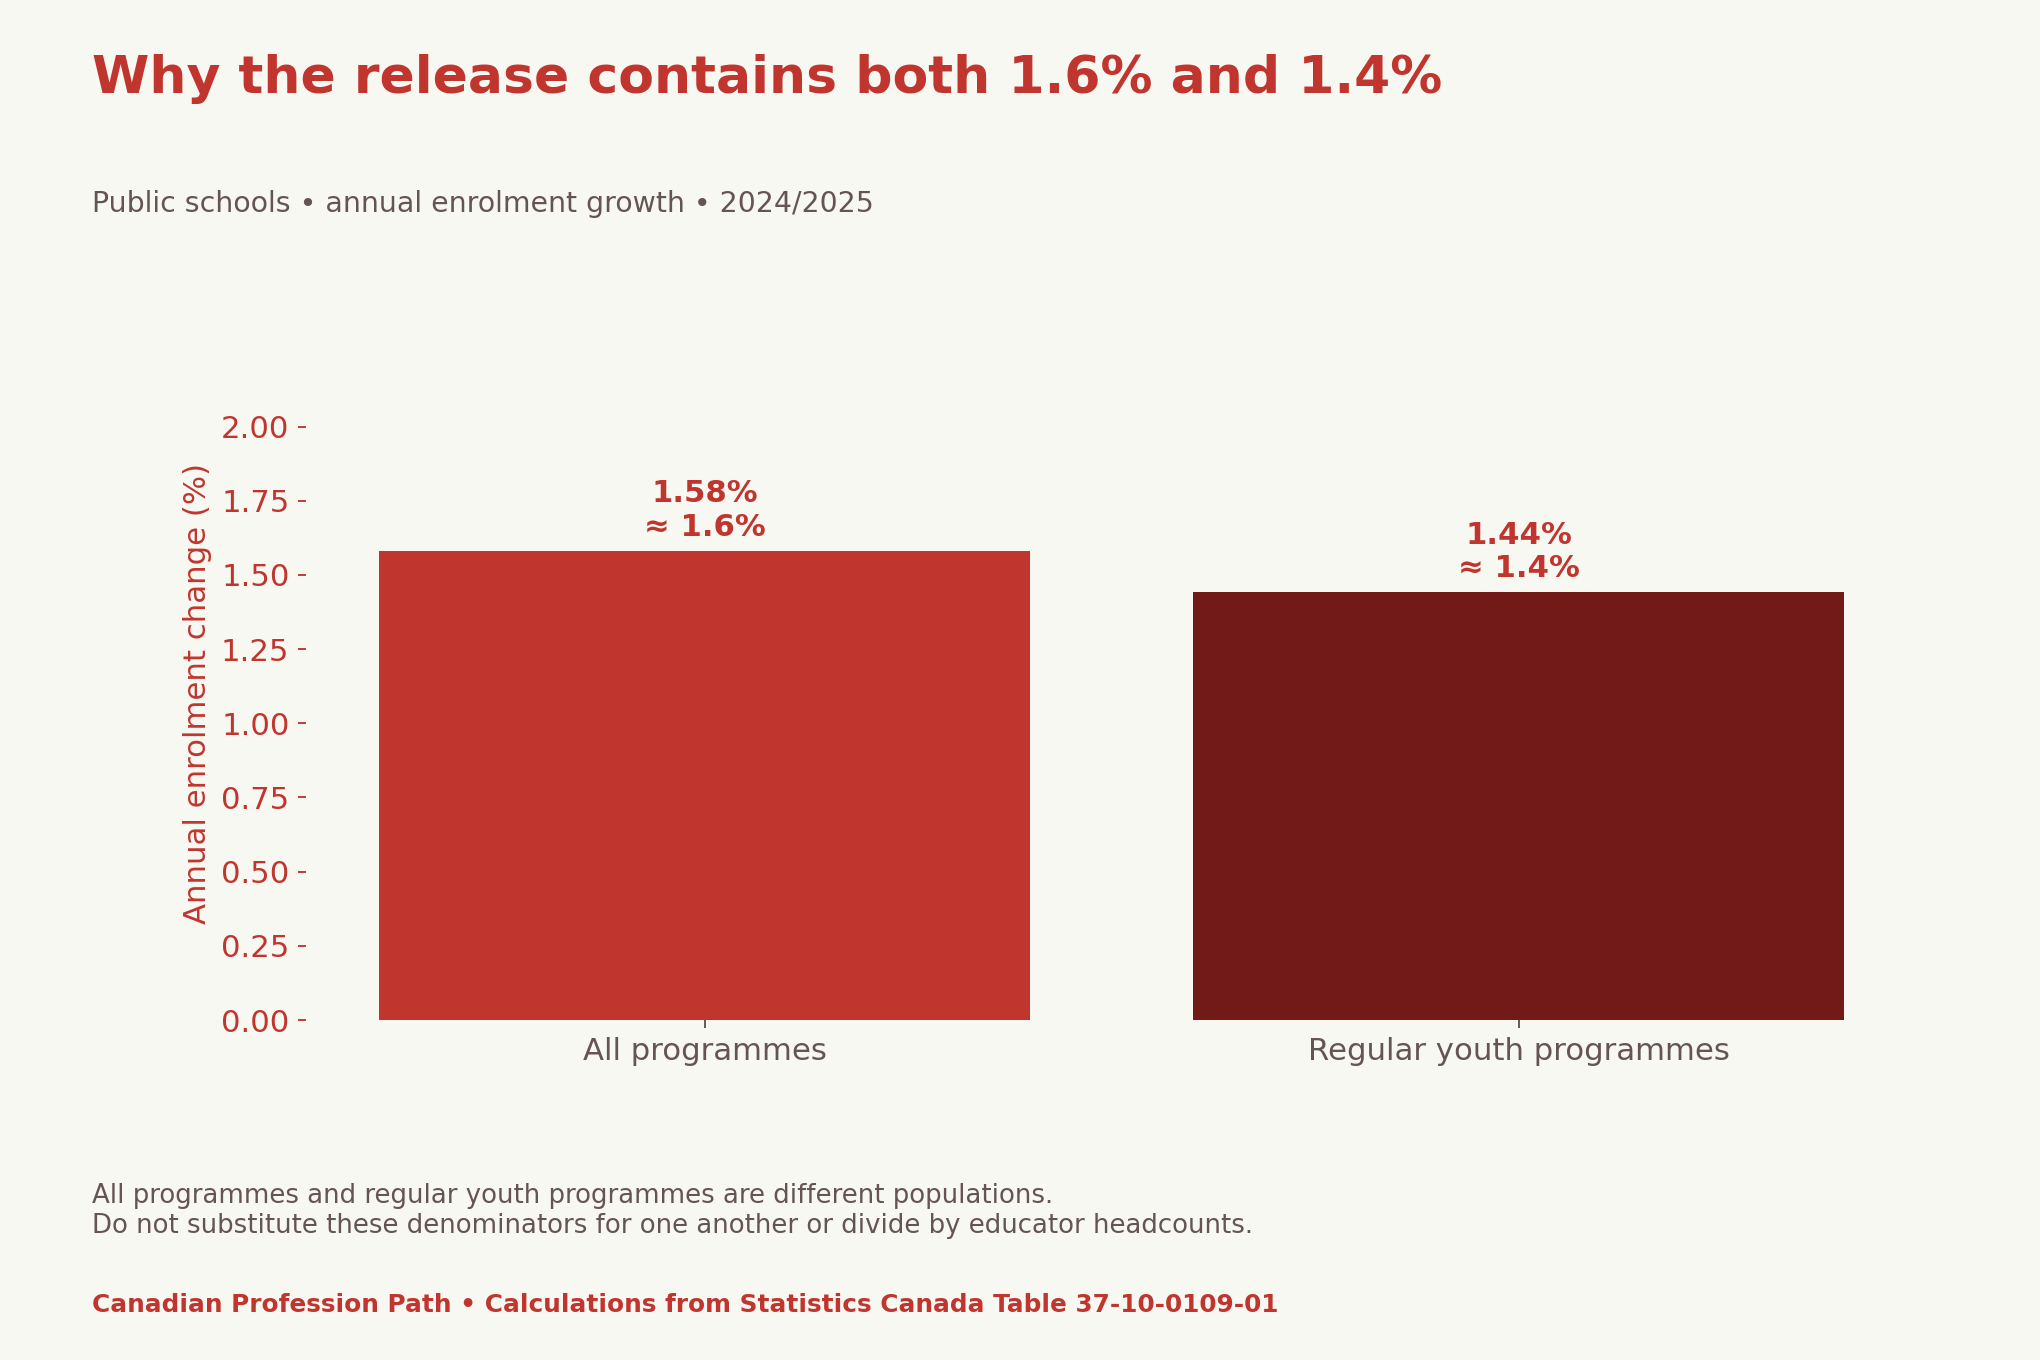
This is also why a rounded student total divided by an educator headcount is not class size. Students and educators are different populations. The educator definition includes teachers, school administrators and pedagogical support. Neither the division nor the national enrolment trend reveals the size of a particular classroom.
Use educator age as context, not a retirement forecast
| Published measure | 2024/2025 value | Interpretation boundary |
|---|---|---|
| Public elementary/secondary educators | 424,500; +0.5% annually | Educator headcount is broader than classroom teachers |
| Educators aged 55 or older | 14.3% | Age distribution, not announced retirements or openings |
A person aged 55 or older may continue working, change duties or retire at a time the national share does not reveal. Do not multiply the age share by a headcount and call the result expected vacancies. A replacement opportunity requires evidence about an actual position, funding and recruitment decision.
Follow the cohort-to-career evidence ladder
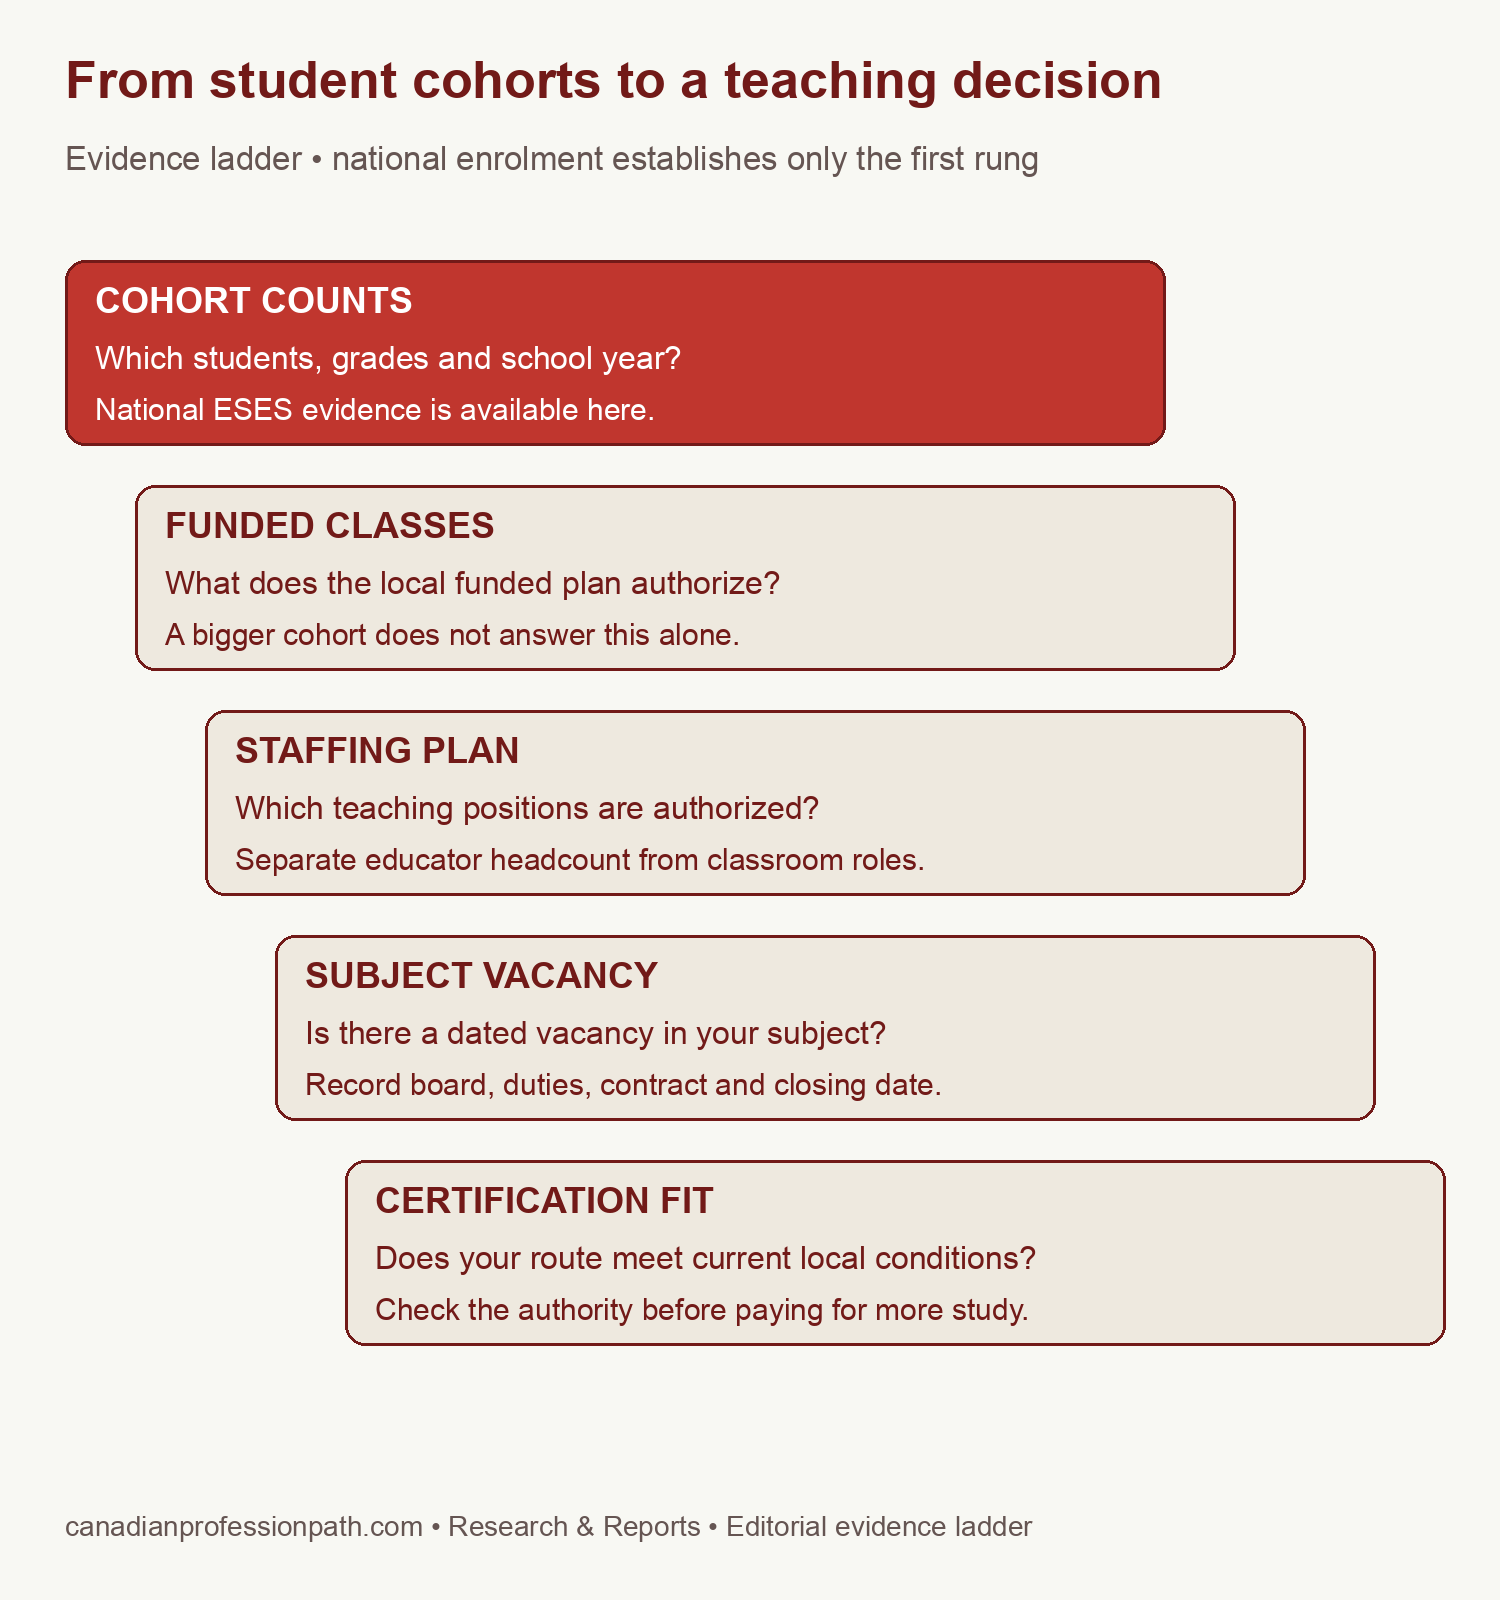
Start with a board and subject you could realistically investigate. Look for dated enrolment projections, funded class plans and authorized staffing information. Then inspect actual vacancies for division, subject, contract type, duties and closing date. Record unknowns as unknown, and distinguish an approved position from an advertisement or a placement promise.
The worksheet leaves these fields blank because national figures do not fill them for you. A board’s projected cohort can change before a job is advertised. An advertised role can also have conditions that your current qualifications do not meet. Keep the source and checked date beside each conclusion.
Verify your qualification route before paying for more study
Use the teaching authority for the province or territory where you intend to work. For example, the Ontario College of Teachers’ internationally educated teacher guidance provides registration resources and country-specific document information. Ontario requires College certification and good standing for teaching in its publicly funded elementary and secondary schools.
That is an Ontario example, not a rule for every Canadian jurisdiction. Newcomers with teacher education from abroad should verify the relevant authority’s recognition process and the actual subject or division conditions. General career guidance does not establish that your credentials have been accepted or that a particular course will qualify you.
Only after those checks should you compare written study costs and timing. Include any stated assessment, travel and document costs relevant to your route. Ask what the provider’s course actually supplies. We do not recommend a specialism, institution or relocation based solely on the national cohort comparison.
For organizing public and private employer research, use our two-track Canadian job-search framework. Our job-search runway guide separates private budget planning from a promised hiring date. These tools support questions and records, not guaranteed outcomes.
Download the source extract and research worksheets
The source file preserves grade rows, programme totals, vector identifiers and the published educator context. The calculations reproduce cohort sums, indices and annual growth. Two blank tools help record board evidence and qualification questions without publishing private documents or identifiers.
- School cohort source extract and educator context (CSV)
- Six-year cohort and programme calculations (CSV)
- Blank province/board teaching research worksheet (CSV)
- Blank qualification-evidence checklist (CSV)
Methods, limitations and citation
We retained both complete official table downloads and metadata on 9 November 2026. Filters select Canada and total sex for the grade table, and public schools for the programme table. The grade groups sum their component rows. Annual growth is the latest count divided by the prior count, minus one, multiplied by 100. Each index divides by that group’s own 2019/2020 count and multiplies by 100.
Administrative reporting differs across jurisdictions. The source randomly rounds counts, and revisions can change earlier values. Small discrepancies between separately published totals and summed cells should not be treated as errors or exact student movements. We do not divide student counts by educator headcounts, rank jurisdictions, model retirements or infer subject-specific vacancies.
Suggested citation: Canadian Profession Path (9 November 2026), “Secondary Teaching Career Prospects Canada 2026: Read Cohorts”, calculations from Statistics Canada Tables 37-10-0007-01 and 37-10-0109-01, 2019/2020–2024/2025, plus the 4 November 2026 ESES release. Retain each programme, grade group and school year when reusing the findings.


