






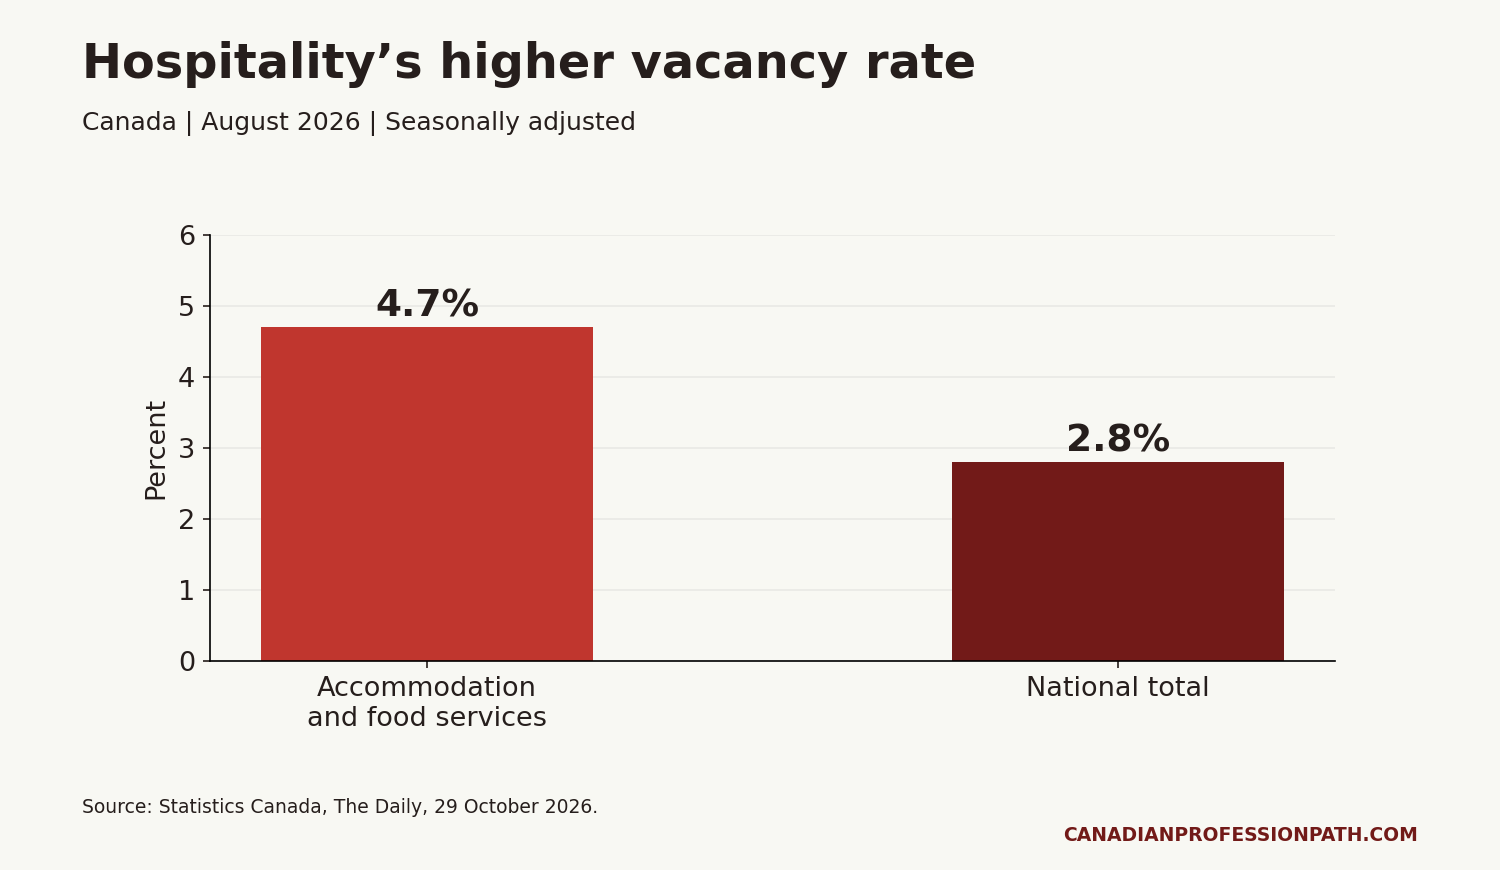
Hospitality job vacancies in Canada in 2026 can rise while payroll employment falls. Statistics Canada’s 29 October release reports August observations for accommodation and food services. Its vacancy rate was 4.7%, compared with 2.8% nationally. However, a vacancy rate alone cannot tell you how many paid hours a particular job offers. Statistics Canada’s August payroll and vacancy release
To evaluate a role, separate three questions. How many positions are vacant? How many employees are receiving pay? What hours and pay terms will this employer commit to? This guide uses the release to explain the first two and provides four CSVs for checking the third.
Read the vacancy rate with its denominator
A job vacancy rate measures vacant positions as a share of total labour demand, which combines filled and vacant positions. In August, accommodation and food services had a higher rate than the national figure. The sector covers a range of businesses and occupations.
A hotel may need receptionists, cleaners, maintenance workers and finance staff. A sector statistic does not identify which of those roles is available near you. First, name the occupation and location you want. Then check a current advert and its closing date.
Annual vacancies and monthly payrolls use different comparisons
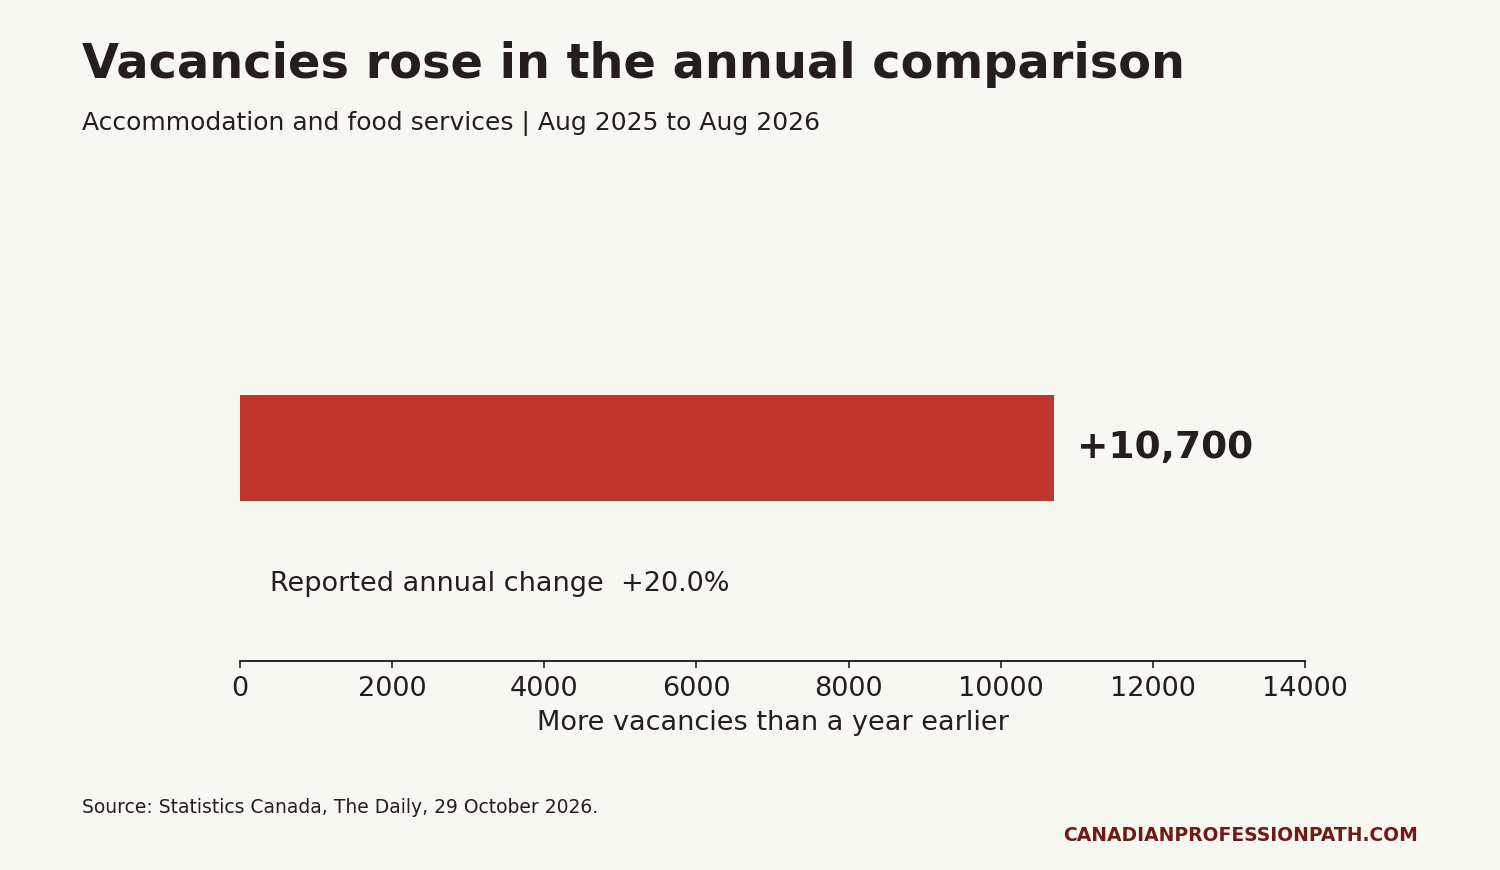
Sector vacancies were 10,700 higher than in August 2025, an annual increase of 20.0%. By contrast, payroll employment fell 6,800 from July to August 2026, a monthly decline of 0.5%. Those comparisons can move in different directions because they use different measures and time windows. Statistics Canada’s sector findings
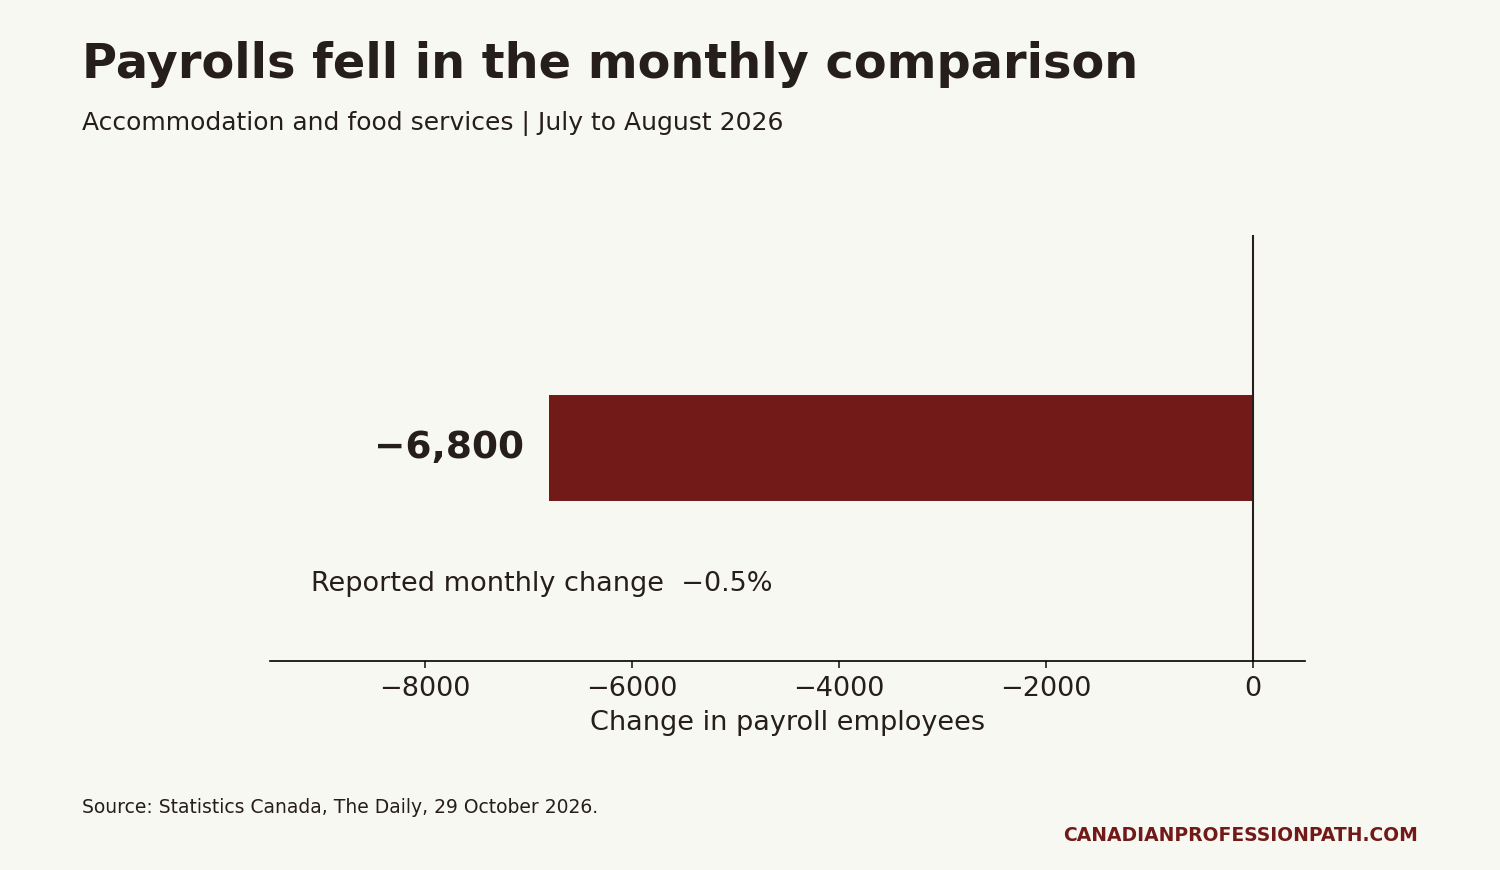
Restaurants accounted for 4,600 of the monthly payroll decline. Before August, the sector had gained 10,800 payroll employees across the preceding four months. One monthly movement therefore needs context, and it cannot explain why an individual employer has an opening.
The indicator and period register (CSV) records the values, units and comparison windows used in the figures. It includes the release date separately from the reference month.
What these figures mean for a job offer
An employer may be replacing a departing worker, adding a shift or recruiting for a different role. Ask which situation applies to the vacancy you are considering. The national release does not establish that reason.
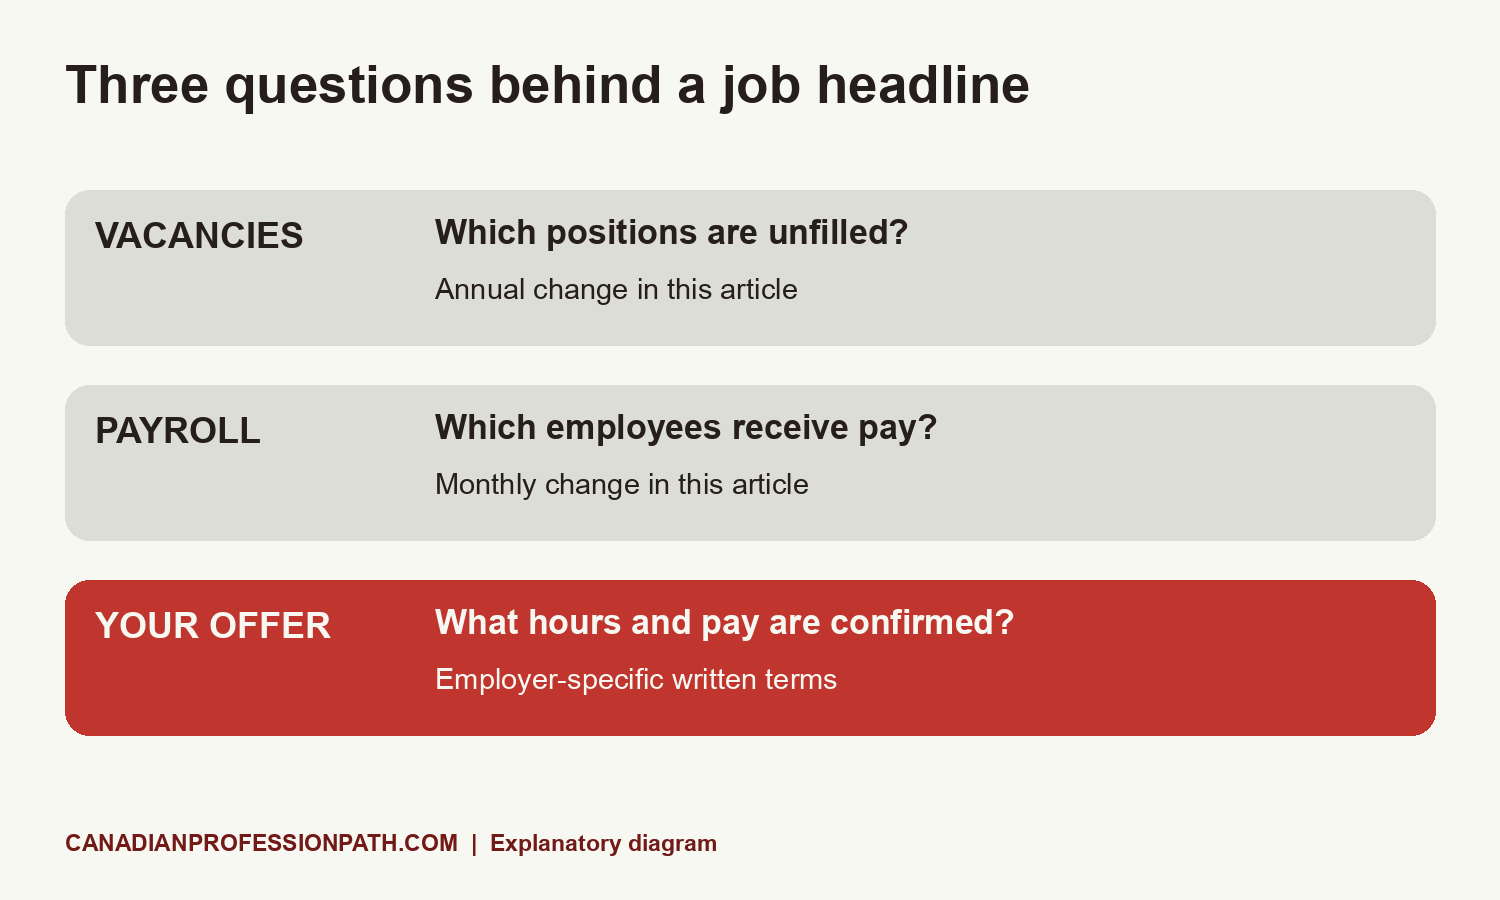
For a career change, make a written offer comparison before you rely on the advertised hourly rate. Record the role, workplace, employment status, ordinary paid hours, schedule and any seasonal limits. If a field is unclear, keep it blank and ask for an answer in writing.
The hospitality offer comparison sheet (CSV) gives each offer its own column. It also separates confirmed terms from questions still waiting for an answer.
A higher hourly rate can produce a lower weekly amount
Consider two fictional offers. Offer A pays CAD 20 per hour for 30 paid hours, giving CAD 600 gross per week. Offer B pays CAD 22 for 25 paid hours, giving CAD 550. These examples exclude deductions, tips, benefits and other payments.
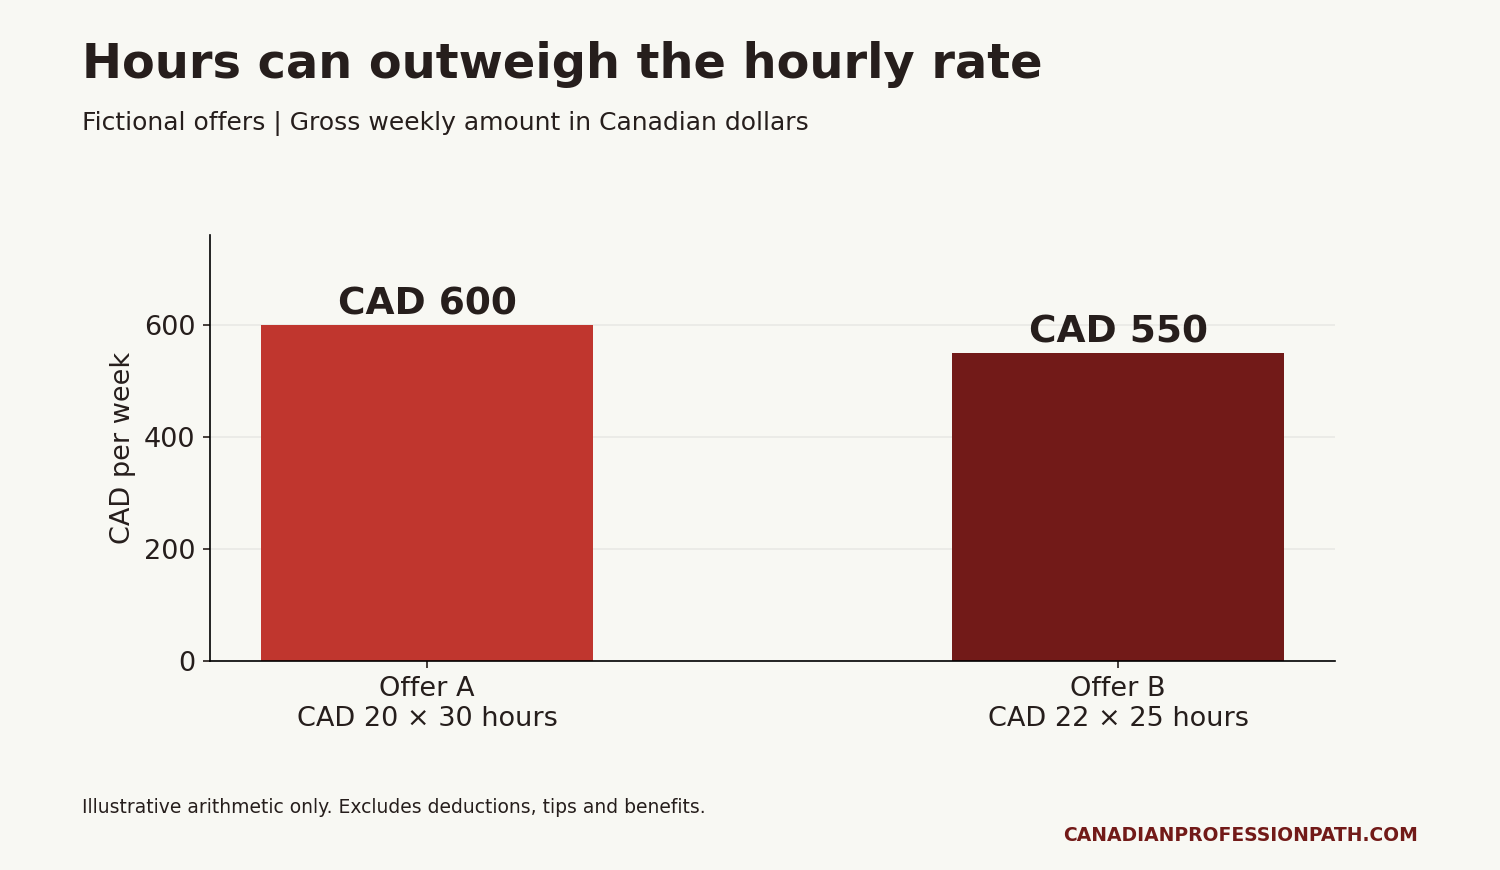
The difference is CAD 50 a week in this example. The lower hourly rate produces the higher total because it comes with more paid hours. To compare your actual offers, replace both the rate and the hours with confirmed terms.
Use the pay-and-hours example (CSV) to reproduce the calculation. Keep uncertain tips and variable shifts separate from a confirmed base amount. If you want to model a range, label its assumptions and show the low and high cases.
Questions that make the comparison clearer
Ask the employer how the proposed schedule works during an ordinary week and during quieter periods. Then check whether the written offer supports the hours you used in the calculation.
- How many paid hours can the employer confirm?
- What is the pay basis, and when is payment made?
- How do tips or service charges work, if applicable?
- What time is spent on unpaid breaks or other unpaid activity?
- How far ahead is the schedule issued, and how are changes handled?
- What evenings, weekends or split shifts are expected?
- Are there seasonal end dates or expected reductions in hours?
- Which required costs would you pay yourself?
Record any answer that affects the comparison in the offer sheet. For example, a split shift may change transport costs or care arrangements even when the paid hours stay the same.
For newcomers, confirm the legal employer, the workplace location and any work-authorization conditions relevant to your circumstances. An advert and an offer can contain different levels of detail. Keep both, along with the employer’s written clarifications.
Build a dated local job log
The blank local job log (CSV) lets you record an advert’s URL, access date, role, location and hours. It also has a field for repeated postings so you can avoid counting the same opening twice.
This article does not provide a current advert sample. The local log is for collecting your own evidence. If you compare roles across sectors or locations, our rural employment research explains why the employer’s industry and a worker’s occupation need separate checks.
Methods and limits
We extracted the published sector figures from Statistics Canada’s 29 October release, as accessed on 5 November 2026. The release presents seasonally adjusted data unless it states otherwise. Payroll employment and job vacancies come from different statistical programs, and preliminary vacancy estimates can be revised.
The pay example is our own arithmetic using fictional inputs. No survey of current offers or employer practices was conducted. The national August figures cannot establish November hiring conditions in a specific town, the hours an employer will offer, or a reason for a particular vacancy.


